| Param | Original file | Final file |
|---|---|---|
| Filename | modeM0/AS1A10_073T01_9000004056cztM0_level2_bc.evt | modeM0/AS1A10_073T01_9000004056cztM0_level2_quad_clean.evt |
| Size (bytes) | 5,819,849,280 | 1,935,527,040 |
| Size | 5.4 GB | 1.8 GB |
| Events in quadrant A | 22,351,038 | 13,791,584 |
| Events in quadrant B | 47,140,636 | 12,955,359 |
| Events in quadrant C | 45,373,256 | 12,639,098 |
| Events in quadrant D | 54,546,285 | 12,328,902 |
| Mode SS | |||
|---|---|---|---|
| Quadrant | BADHDUFLAG | Total packets | Discarded packets |
| A | 0 | 2048 | 0 |
| B | 0 | 2048 | 0 |
| C | 0 | 2048 | 0 |
| D | 0 | 2048 | 0 |
| Mode M9 | |||
|---|---|---|---|
| Quadrant | BADHDUFLAG | Total packets | Discarded packets |
| A | 0 | 145 | 0 |
| B | 0 | 145 | 0 |
| C | 0 | 145 | 0 |
| D | 0 | 145 | 0 |
| Mode M0 | |||
|---|---|---|---|
| Quadrant | BADHDUFLAG | Total packets | Discarded packets |
| A | 0 | 209165 | 0 |
| B | 0 | 312210 | 0 |
| C | 0 | 290589 | 0 |
| D | 0 | 327169 | 0 |
| Quadrant | Total seconds | Saturated seconds | Saturation percentage |
|---|---|---|---|
| A | 100810 | 929 | 0.921536% |
| B | 100810 | 11892 | 11.796449% |
| C | 100810 | 5774 | 5.727606% |
| D | 100810 | 8517 | 8.448567% |
Noise dominated data is calculated using 1-second bins in cleaned event files. If a bin has >2000 counts, and if more than 50% of those come from <1% of pixels, then it is considered to be noise-dominated and hence unusable.
| Quadrant | # 1 sec bins | Bins with >0 counts | Bins with >2000 counts | High rate bins dominated by noise | Noise dominated (total time) | Noise dominated (detector-on time) | Marked lightcurve |
|---|---|---|---|---|---|---|---|
| A | 115216 | 100810 | 46 | 46 | 0.04% | 0.05% |  |
| B | 115216 | 100803 | 471 | 471 | 0.41% | 0.47% |  |
| C | 115216 | 100808 | 233 | 233 | 0.20% | 0.23% |  |
| D | 115216 | 100804 | 1259 | 1259 | 1.09% | 1.25% |  |
Top three noisy pixels from each quadrant. If the there are fewer than three noisy pixels in the level2.evt file, extra rows are filled as -1
| Pixel properties | Quadrant properties | ||||||
|---|---|---|---|---|---|---|---|
| Quadrant | DetID | PixID | Counts | Sigma | Mean | Median | Sigma |
| A | 0 | 13 | 718521 | 593.23 | 5514 | 5447 | 1202.0 |
| A | 13 | 254 | 164357 | 132.2 | 5514 | 5447 | 1202.0 |
| A | 13 | 170 | 125608 | 99.96 | 5514 | 5447 | 1202.0 |
| B | 10 | 245 | 26214010 | 26578.5 | 5206 | 5102 | 986.1 |
| B | 0 | 190 | 217747 | 215.64 | 5206 | 5102 | 986.1 |
| B | 4 | 200 | 187912 | 185.39 | 5206 | 5102 | 986.1 |
| C | 3 | 233 | 25765898 | 21276.41 | 5072 | 5053 | 1210.8 |
| C | 2 | 16 | 71533 | 54.91 | 5072 | 5053 | 1210.8 |
| C | 15 | 208 | 39281 | 28.27 | 5072 | 5053 | 1210.8 |
| D | 1 | 52 | 15349793 | 12783.59 | 5176 | 5030 | 1200.3 |
| D | 8 | 195 | 10418686 | 8675.53 | 5176 | 5030 | 1200.3 |
| D | 2 | 250 | 3280687 | 2728.92 | 5176 | 5030 | 1200.3 |
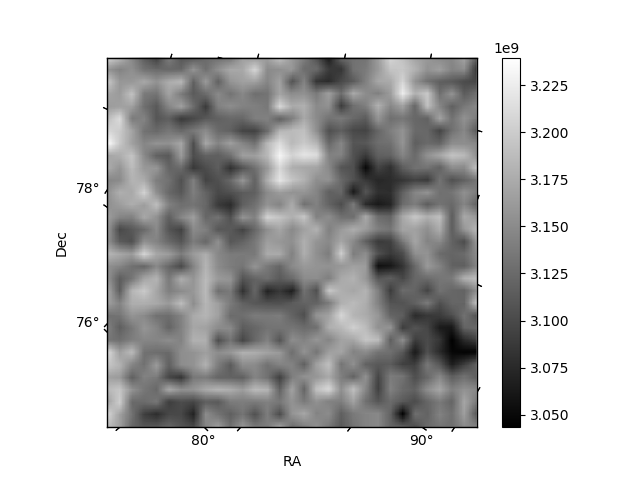
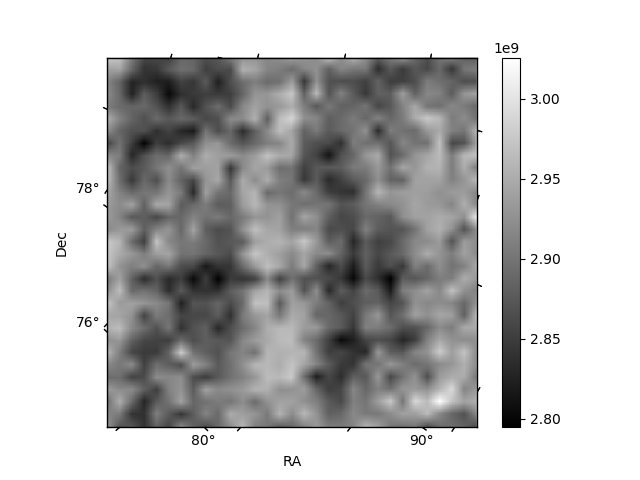
Histogram calculated using DETX and DETY for each event in the final _common_clean file
| Quadrant A |  |
 |
Quadrant B |
|---|---|---|---|
| Quadrant D |  |
 |
Quadrant C |
| Plot type | Count rate plots | Images |
|---|---|---|
| Comparison with Poisson distribution Blue bars denote a histogram of data divided into 1 sec bins. Red curve is a Poisson curve with rate = median count rate of data. |
 |
 |
| Quadrant-wise count rates Data is divided into 100 sec bins |
 |
|
| Module-wise count rates for Quadrant A Data is divided into 100 sec bins |
 |
 |
| Module-wise count rates for Quadrant B Data is divided into 100 sec bins |
 |
 |
| Module-wise count rates for Quadrant C Data is divided into 100 sec bins |
 |
 |
| Module-wise count rates for Quadrant D Data is divided into 100 sec bins |
 |
 |
| Parameter | Plot |
|---|---|
| CZT HV Monitor |  |
| D_VDD |  |
| Temperature 1 |  |
| Veto HV Monitor | 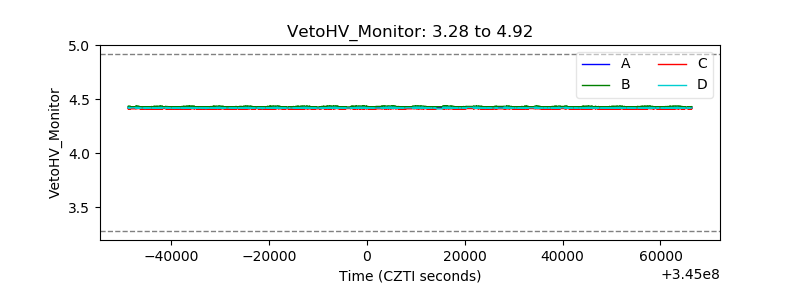 |
| Veto LLD | 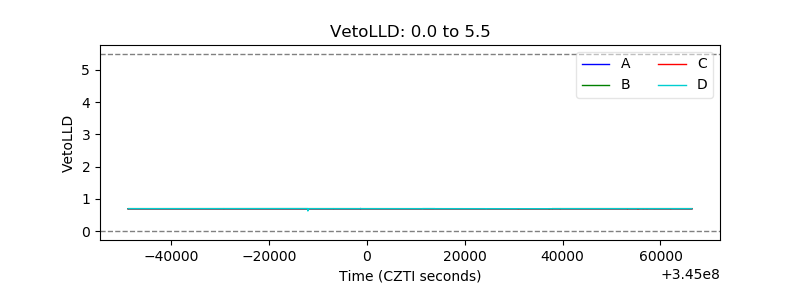 |
| Alpha Counter |  |
| _CPM_Rate |  |
| CZT Counter |  |
| +2.5 Volts monitor |  |
| +5 Volts monitor |  |
| _ROLL_ROT | 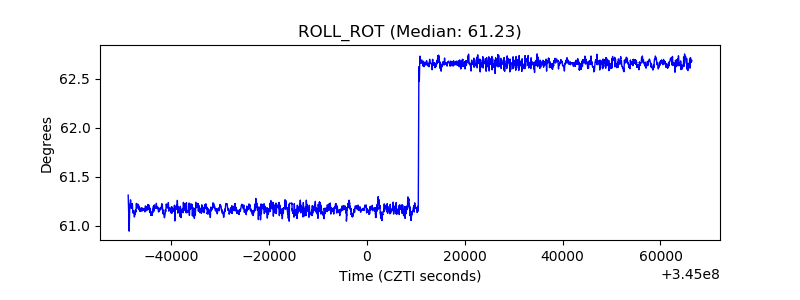 |
| _Roll_DEC | 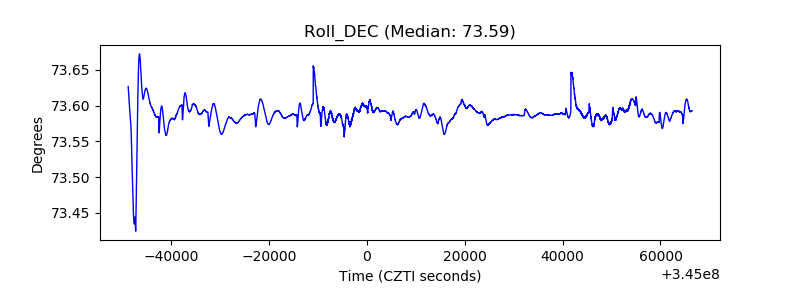 |
| _Roll_RA |  |
| Veto Counter |  |