| Param | Original file | Final file |
|---|---|---|
| Filename | modeM0/AS1A10_057T02_9000004054cztM0_level2_bc.evt | modeM0/AS1A10_057T02_9000004054cztM0_level2_quad_clean.evt |
| Size (bytes) | 4,108,461,120 | 1,007,899,200 |
| Size | 3.8 GB | 961.2 MB |
| Events in quadrant A | 18,617,777 | 6,610,051 |
| Events in quadrant B | 29,201,822 | 6,255,261 |
| Events in quadrant C | 21,736,871 | 6,276,053 |
| Events in quadrant D | 49,525,046 | 5,994,731 |
| Mode M9 | |||
|---|---|---|---|
| Quadrant | BADHDUFLAG | Total packets | Discarded packets |
| A | 0 | 132 | 0 |
| B | 0 | 133 | 0 |
| C | 0 | 134 | 0 |
| D | 0 | 134 | 0 |
| Mode SS | |||
|---|---|---|---|
| Quadrant | BADHDUFLAG | Total packets | Discarded packets |
| A | 0 | 1594 | 0 |
| B | 0 | 1602 | 0 |
| C | 0 | 1596 | 0 |
| D | 0 | 1600 | 0 |
| Mode M0 | |||
|---|---|---|---|
| Quadrant | BADHDUFLAG | Total packets | Discarded packets |
| A | 0 | 168716 | 0 |
| B | 0 | 221465 | 0 |
| C | 0 | 183588 | 0 |
| D | 0 | 273527 | 0 |
| Quadrant | Total seconds | Saturated seconds | Saturation percentage |
|---|---|---|---|
| A | 78641 | 934 | 1.187676% |
| B | 78644 | 8253 | 10.494125% |
| C | 78637 | 2096 | 2.665412% |
| D | 78530 | 6597 | 8.400611% |
Noise dominated data is calculated using 1-second bins in cleaned event files. If a bin has >2000 counts, and if more than 50% of those come from <1% of pixels, then it is considered to be noise-dominated and hence unusable.
| Quadrant | # 1 sec bins | Bins with >0 counts | Bins with >2000 counts | High rate bins dominated by noise | Noise dominated (total time) | Noise dominated (detector-on time) | Marked lightcurve |
|---|---|---|---|---|---|---|---|
| A | 91858 | 78803 | 1 | 1 | 0.00% | 0.00% |  |
| B | 91858 | 78815 | 162 | 162 | 0.18% | 0.21% |  |
| C | 91858 | 78811 | 32 | 32 | 0.03% | 0.04% |  |
| D | 91859 | 78654 | 1451 | 1451 | 1.58% | 1.84% |  |
Top three noisy pixels from each quadrant. If the there are fewer than three noisy pixels in the level2.evt file, extra rows are filled as -1
| Pixel properties | Quadrant properties | ||||||
|---|---|---|---|---|---|---|---|
| Quadrant | DetID | PixID | Counts | Sigma | Mean | Median | Sigma |
| A | 0 | 13 | 1294241 | 1357.9 | 4423 | 4363 | 949.9 |
| A | 13 | 254 | 127298 | 129.42 | 4423 | 4363 | 949.9 |
| A | 12 | 96 | 111429 | 112.71 | 4423 | 4363 | 949.9 |
| B | 10 | 245 | 12419203 | 15757.81 | 4192 | 4101 | 787.9 |
| B | 4 | 200 | 133772 | 164.58 | 4192 | 4101 | 787.9 |
| B | 4 | 52 | 130704 | 160.69 | 4192 | 4101 | 787.9 |
| C | 3 | 233 | 5675570 | 5845.87 | 4154 | 4143 | 970.2 |
| C | 15 | 208 | 62481 | 60.13 | 4154 | 4143 | 970.2 |
| C | 8 | 128 | 24813 | 21.31 | 4154 | 4143 | 970.2 |
| D | 8 | 195 | 20942029 | 22290.98 | 4164 | 4043 | 939.3 |
| D | 1 | 52 | 6701492 | 7130.23 | 4164 | 4043 | 939.3 |
| D | 2 | 250 | 3447776 | 3666.26 | 4164 | 4043 | 939.3 |
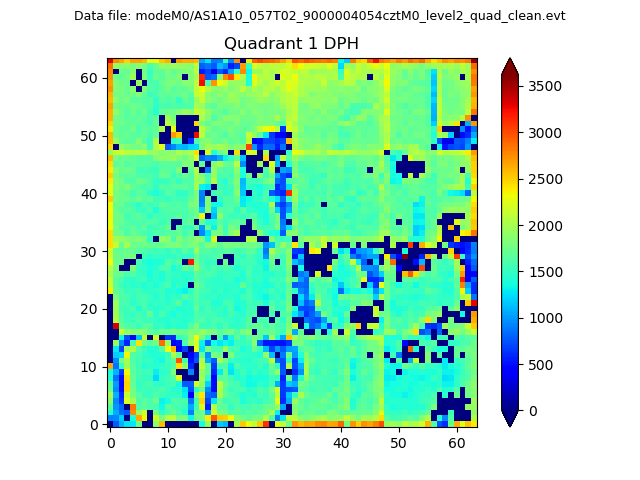
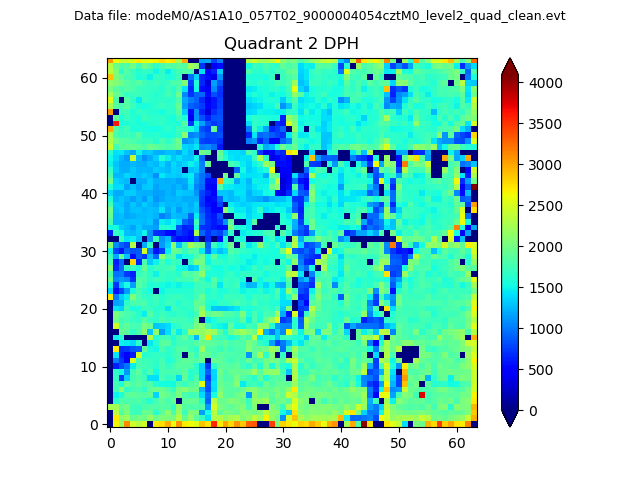
Histogram calculated using DETX and DETY for each event in the final _common_clean file
| Quadrant A |  |
 |
Quadrant B |
|---|---|---|---|
| Quadrant D |  |
 |
Quadrant C |
| Plot type | Count rate plots | Images |
|---|---|---|
| Comparison with Poisson distribution Blue bars denote a histogram of data divided into 1 sec bins. Red curve is a Poisson curve with rate = median count rate of data. |
 |
 |
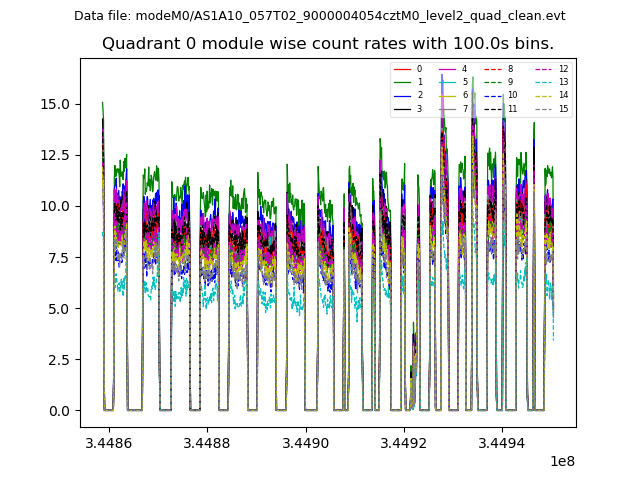
| Quadrant-wise count rates Data is divided into 100 sec bins |
 |
|
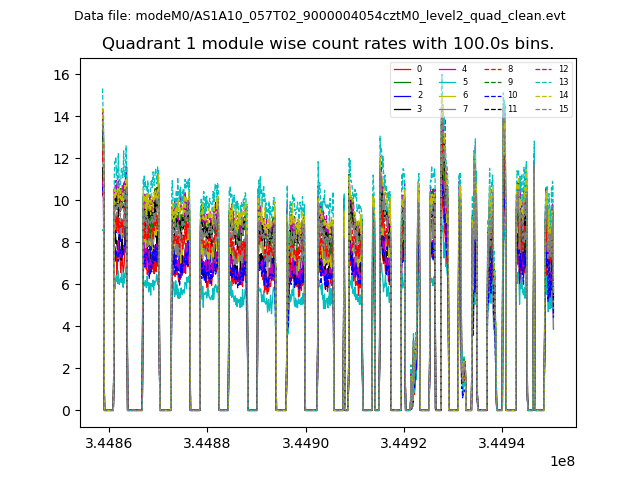
| Module-wise count rates for Quadrant A Data is divided into 100 sec bins |
 |
 |
| Module-wise count rates for Quadrant B Data is divided into 100 sec bins |
 |
 |
| Module-wise count rates for Quadrant C Data is divided into 100 sec bins |
 |
 |
| Module-wise count rates for Quadrant D Data is divided into 100 sec bins |
 |
 |
| Parameter | Plot |
|---|---|
| CZT HV Monitor | 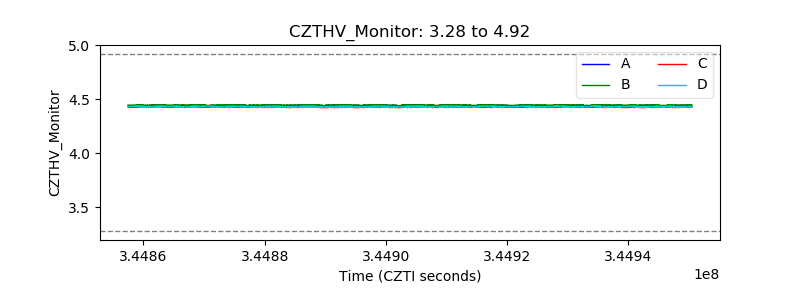 |
| D_VDD |  |
| Temperature 1 |  |
| Veto HV Monitor |  |
| Veto LLD | 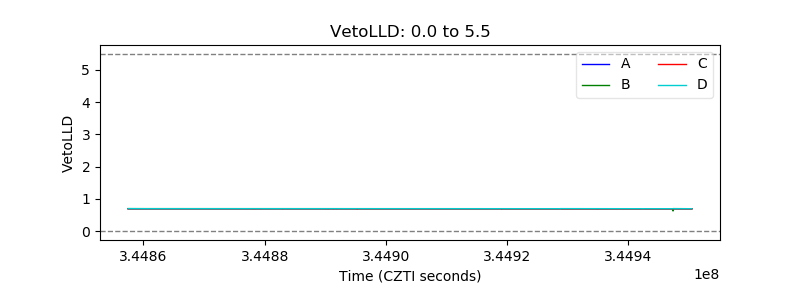 |
| Alpha Counter |  |
| _CPM_Rate |  |
| CZT Counter |  |
| +2.5 Volts monitor |  |
| +5 Volts monitor | 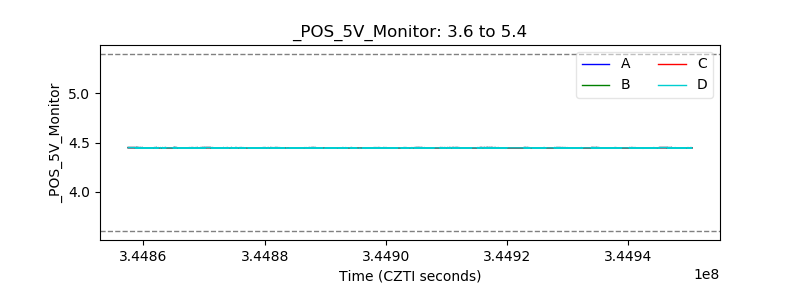 |
| _ROLL_ROT | 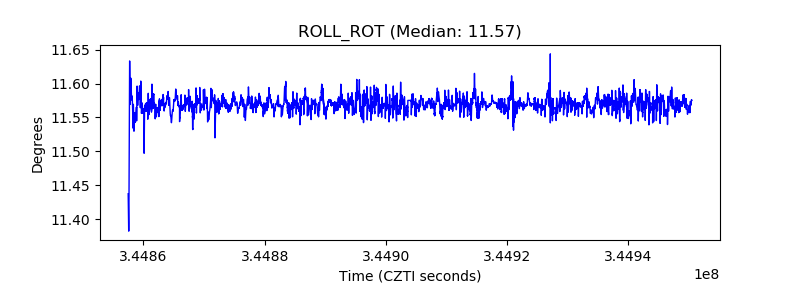 |
| _Roll_DEC |  |
| _Roll_RA |  |
| Veto Counter | 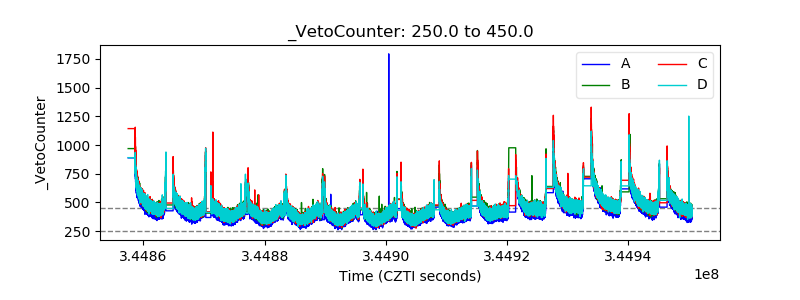 |