| Param | Original file | Final file |
|---|---|---|
| Filename | modeM0/AS1A10_045T03_9000004052cztM0_level2_bc.evt | modeM0/AS1A10_045T03_9000004052cztM0_level2_quad_clean.evt |
| Size (bytes) | 1,684,532,160 | 521,092,800 |
| Size | 1.6 GB | 497.0 MB |
| Events in quadrant A | 7,948,750 | 3,425,525 |
| Events in quadrant B | 7,982,948 | 3,441,783 |
| Events in quadrant C | 8,763,070 | 3,284,096 |
| Events in quadrant D | 23,794,868 | 3,087,660 |
| Mode SS | |||
|---|---|---|---|
| Quadrant | BADHDUFLAG | Total packets | Discarded packets |
| A | 0 | 758 | 0 |
| B | 0 | 760 | 0 |
| C | 0 | 762 | 0 |
| D | 0 | 758 | 0 |
| Mode M0 | |||
|---|---|---|---|
| Quadrant | BADHDUFLAG | Total packets | Discarded packets |
| A | 0 | 76849 | 0 |
| B | 0 | 77393 | 0 |
| C | 0 | 81203 | 0 |
| D | 0 | 129194 | 0 |
| Mode M9 | |||
|---|---|---|---|
| Quadrant | BADHDUFLAG | Total packets | Discarded packets |
| A | 0 | 60 | 0 |
| B | 0 | 58 | 0 |
| C | 0 | 58 | 0 |
| D | 0 | 56 | 0 |
| Quadrant | Total seconds | Saturated seconds | Saturation percentage |
|---|---|---|---|
| A | 37098 | 273 | 0.735889% |
| B | 36974 | 418 | 1.130524% |
| C | 37097 | 683 | 1.841119% |
| D | 36973 | 4353 | 11.773456% |
Noise dominated data is calculated using 1-second bins in cleaned event files. If a bin has >2000 counts, and if more than 50% of those come from <1% of pixels, then it is considered to be noise-dominated and hence unusable.
| Quadrant | # 1 sec bins | Bins with >0 counts | Bins with >2000 counts | High rate bins dominated by noise | Noise dominated (total time) | Noise dominated (detector-on time) | Marked lightcurve |
|---|---|---|---|---|---|---|---|
| A | 41668 | 36636 | 0 | 0 | 0.00% | 0.00% |  |
| B | 41668 | 36619 | 0 | 0 | 0.00% | 0.00% | 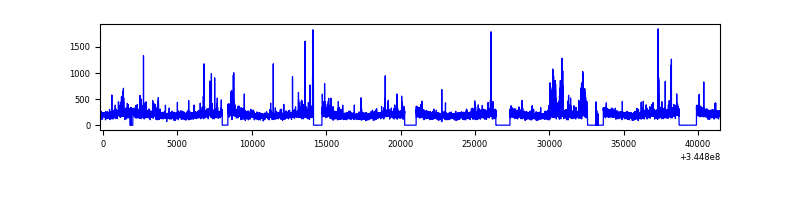 |
| C | 41668 | 36643 | 0 | 0 | 0.00% | 0.00% | 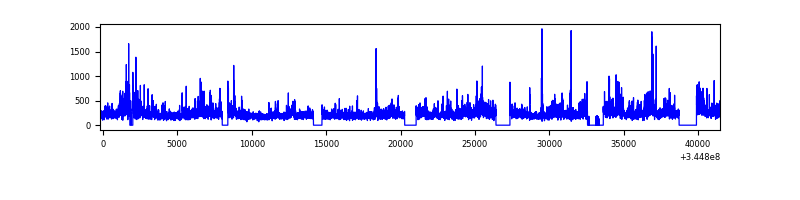 |
| D | 41668 | 36620 | 1667 | 1667 | 4.00% | 4.55% |  |
Top three noisy pixels from each quadrant. If the there are fewer than three noisy pixels in the level2.evt file, extra rows are filled as -1
| Pixel properties | Quadrant properties | ||||||
|---|---|---|---|---|---|---|---|
| Quadrant | DetID | PixID | Counts | Sigma | Mean | Median | Sigma |
| A | 0 | 13 | 247766 | 566.5 | 1986 | 1956 | 433.9 |
| A | 13 | 254 | 58650 | 130.66 | 1986 | 1956 | 433.9 |
| A | 1 | 113 | 22063 | 46.34 | 1986 | 1956 | 433.9 |
| B | 10 | 245 | 130069 | 339.95 | 1974 | 1926 | 377.0 |
| B | 4 | 200 | 71528 | 184.64 | 1974 | 1926 | 377.0 |
| B | 4 | 52 | 63917 | 164.45 | 1974 | 1926 | 377.0 |
| C | 3 | 233 | 1269013 | 2857.03 | 1882 | 1874 | 443.5 |
| C | 15 | 208 | 177786 | 396.63 | 1882 | 1874 | 443.5 |
| C | 8 | 222 | 49242 | 106.8 | 1882 | 1874 | 443.5 |
| D | 8 | 195 | 7501150 | 17592.33 | 1840 | 1786 | 426.3 |
| D | 1 | 52 | 4474412 | 10492.08 | 1840 | 1786 | 426.3 |
| D | 7 | 223 | 1889348 | 4427.92 | 1840 | 1786 | 426.3 |
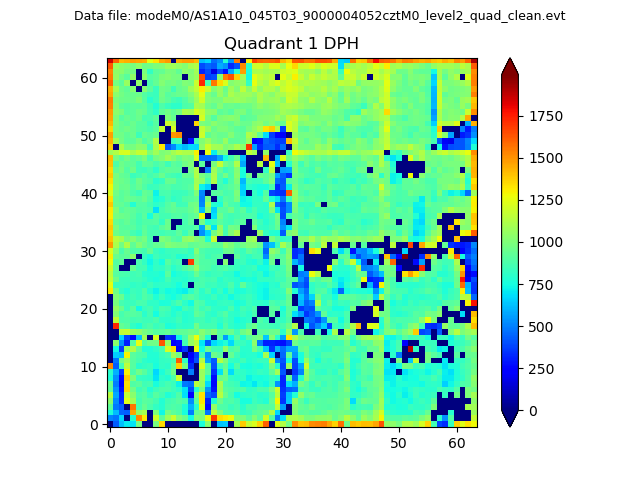
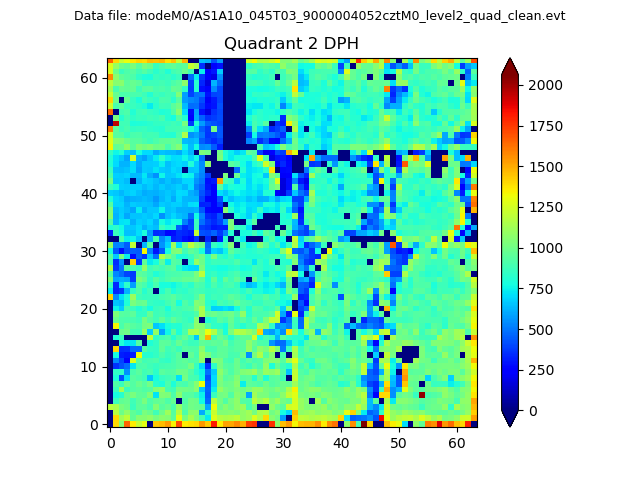
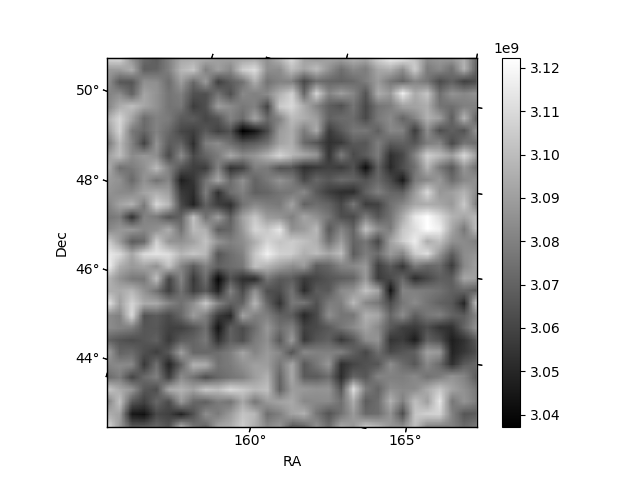
Histogram calculated using DETX and DETY for each event in the final _common_clean file
| Quadrant A |  |
 |
Quadrant B |
|---|---|---|---|
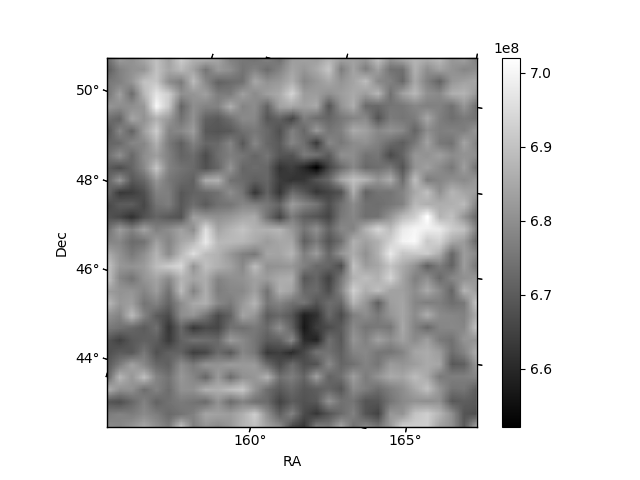
| Quadrant D |  |
 |
Quadrant C |
| Plot type | Count rate plots | Images |
|---|---|---|
| Comparison with Poisson distribution Blue bars denote a histogram of data divided into 1 sec bins. Red curve is a Poisson curve with rate = median count rate of data. |
 |
 |
| Quadrant-wise count rates Data is divided into 100 sec bins |
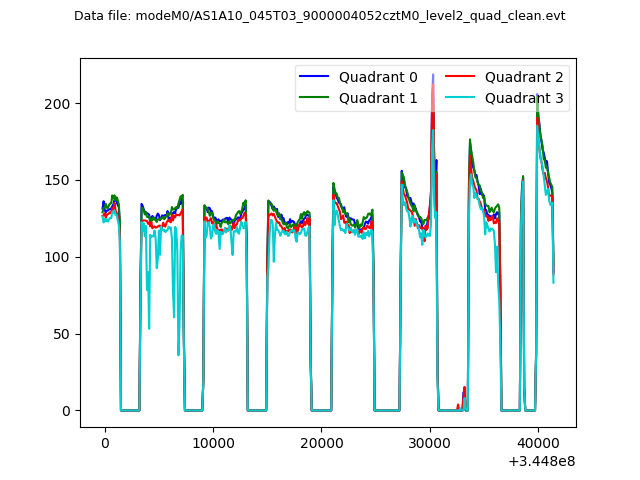 |
|
| Module-wise count rates for Quadrant A Data is divided into 100 sec bins |
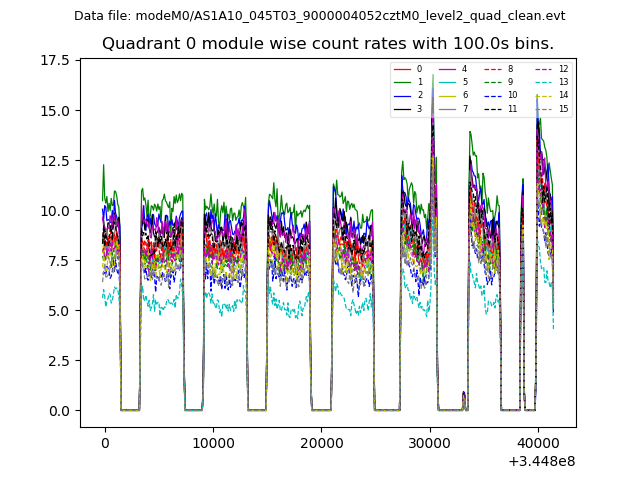 |
 |
| Module-wise count rates for Quadrant B Data is divided into 100 sec bins |
 |
 |
| Module-wise count rates for Quadrant C Data is divided into 100 sec bins |
 |
 |
| Module-wise count rates for Quadrant D Data is divided into 100 sec bins |
 |
 |
| Parameter | Plot |
|---|---|
| CZT HV Monitor |  |
| D_VDD |  |
| Temperature 1 |  |
| Veto HV Monitor |  |
| Veto LLD |  |
| Alpha Counter |  |
| _CPM_Rate |  |
| CZT Counter |  |
| +2.5 Volts monitor |  |
| +5 Volts monitor | 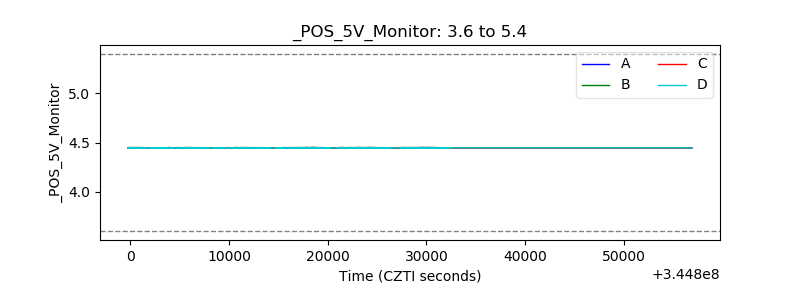 |
| _ROLL_ROT |  |
| _Roll_DEC | 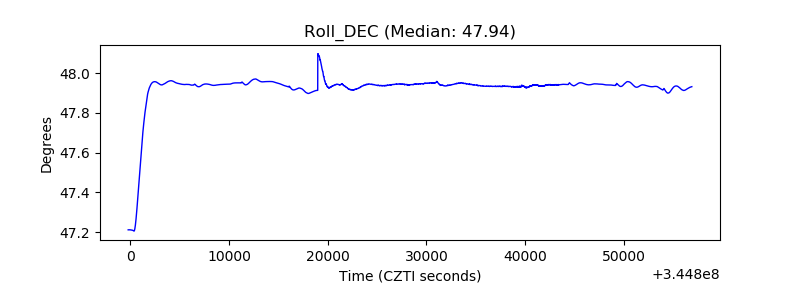 |
| _Roll_RA |  |
| Veto Counter | 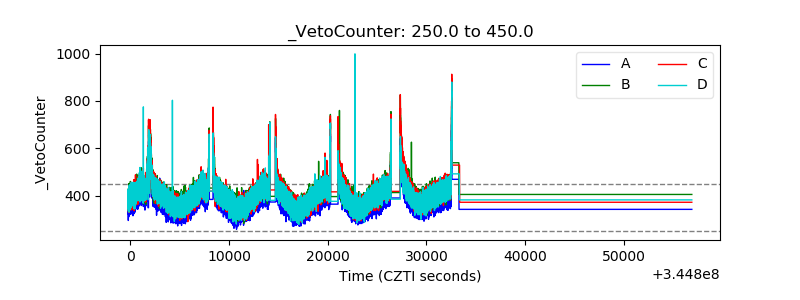 |