| Param | Original file | Final file |
|---|---|---|
| Filename | modeM0/AS1A10_048T02_9000004050cztM0_level2_bc.evt | modeM0/AS1A10_048T02_9000004050cztM0_level2_quad_clean.evt |
| Size (bytes) | 3,545,501,760 | 1,091,986,560 |
| Size | 3.3 GB | 1.0 GB |
| Events in quadrant A | 18,075,561 | 7,121,375 |
| Events in quadrant B | 18,499,232 | 7,130,187 |
| Events in quadrant C | 19,546,057 | 6,748,073 |
| Events in quadrant D | 45,706,146 | 6,483,792 |
| Mode M0 | |||
|---|---|---|---|
| Quadrant | BADHDUFLAG | Total packets | Discarded packets |
| A | 0 | 171442 | 0 |
| B | 0 | 173692 | 0 |
| C | 0 | 181079 | 0 |
| D | 0 | 263050 | 0 |
| Mode SS | |||
|---|---|---|---|
| Quadrant | BADHDUFLAG | Total packets | Discarded packets |
| A | 0 | 1668 | 0 |
| B | 0 | 1668 | 0 |
| C | 0 | 1668 | 0 |
| D | 0 | 1668 | 0 |
| Mode M9 | |||
|---|---|---|---|
| Quadrant | BADHDUFLAG | Total packets | Discarded packets |
| A | 0 | 117 | 0 |
| B | 0 | 117 | 0 |
| C | 0 | 117 | 0 |
| D | 0 | 117 | 0 |
| Quadrant | Total seconds | Saturated seconds | Saturation percentage |
|---|---|---|---|
| A | 81548 | 927 | 1.136754% |
| B | 81548 | 1170 | 1.434738% |
| C | 81548 | 1683 | 2.063815% |
| D | 81548 | 5004 | 6.136263% |
Noise dominated data is calculated using 1-second bins in cleaned event files. If a bin has >2000 counts, and if more than 50% of those come from <1% of pixels, then it is considered to be noise-dominated and hence unusable.
| Quadrant | # 1 sec bins | Bins with >0 counts | Bins with >2000 counts | High rate bins dominated by noise | Noise dominated (total time) | Noise dominated (detector-on time) | Marked lightcurve |
|---|---|---|---|---|---|---|---|
| A | 93583 | 81542 | 5 | 5 | 0.01% | 0.01% |  |
| B | 93583 | 81537 | 3 | 3 | 0.00% | 0.00% |  |
| C | 93583 | 81542 | 6 | 6 | 0.01% | 0.01% |  |
| D | 93583 | 81538 | 1905 | 1905 | 2.04% | 2.34% |  |
Top three noisy pixels from each quadrant. If the there are fewer than three noisy pixels in the level2.evt file, extra rows are filled as -1
| Pixel properties | Quadrant properties | ||||||
|---|---|---|---|---|---|---|---|
| Quadrant | DetID | PixID | Counts | Sigma | Mean | Median | Sigma |
| A | 13 | 254 | 119181 | 115.58 | 4629 | 4560 | 991.7 |
| A | 6 | 16 | 104915 | 101.2 | 4629 | 4560 | 991.7 |
| A | 0 | 13 | 77169 | 73.22 | 4629 | 4560 | 991.7 |
| B | 10 | 245 | 290645 | 329.84 | 4662 | 4561 | 867.3 |
| B | 4 | 200 | 75849 | 82.19 | 4662 | 4561 | 867.3 |
| B | 0 | 183 | 73025 | 78.94 | 4662 | 4561 | 867.3 |
| C | 3 | 233 | 2372620 | 2311.48 | 4421 | 4427 | 1024.5 |
| C | 10 | 22 | 131424 | 123.96 | 4421 | 4427 | 1024.5 |
| C | 2 | 16 | 35221 | 30.06 | 4421 | 4427 | 1024.5 |
| D | 8 | 195 | 13377040 | 13328.11 | 4430 | 4301 | 1003.3 |
| D | 1 | 52 | 12269829 | 12224.6 | 4430 | 4301 | 1003.3 |
| D | 7 | 80 | 2675518 | 2662.3 | 4430 | 4301 | 1003.3 |
Histogram calculated using DETX and DETY for each event in the final _common_clean file
| Quadrant A |  |
 |
Quadrant B |
|---|---|---|---|
| Quadrant D |  |
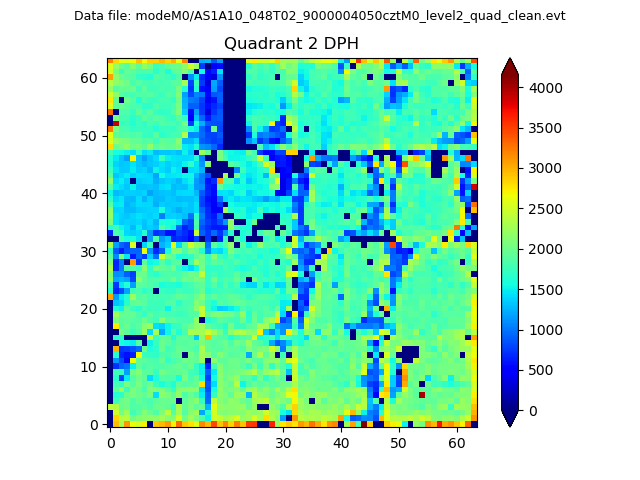 |
Quadrant C |
| Plot type | Count rate plots | Images |
|---|---|---|
| Comparison with Poisson distribution Blue bars denote a histogram of data divided into 1 sec bins. Red curve is a Poisson curve with rate = median count rate of data. |
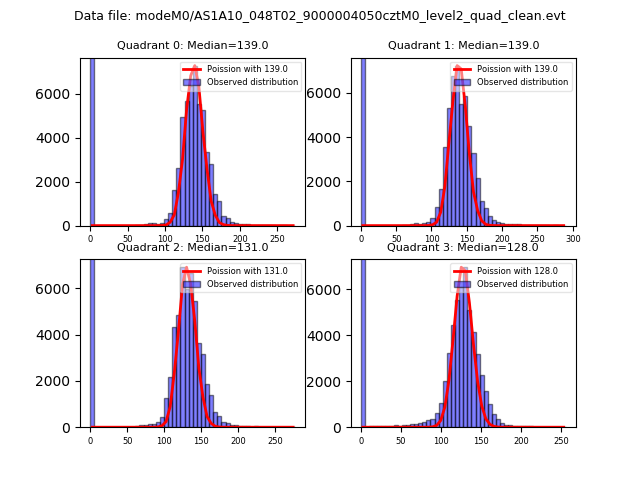 |
 |
| Quadrant-wise count rates Data is divided into 100 sec bins |
 |
|
| Module-wise count rates for Quadrant A Data is divided into 100 sec bins |
 |
 |
| Module-wise count rates for Quadrant B Data is divided into 100 sec bins |
 |
 |
| Module-wise count rates for Quadrant C Data is divided into 100 sec bins |
 |
 |
| Module-wise count rates for Quadrant D Data is divided into 100 sec bins |
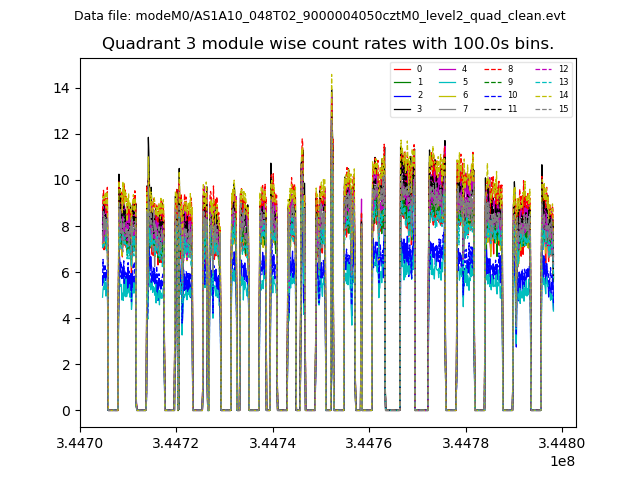 |
 |
| Parameter | Plot |
|---|---|
| CZT HV Monitor |  |
| D_VDD | 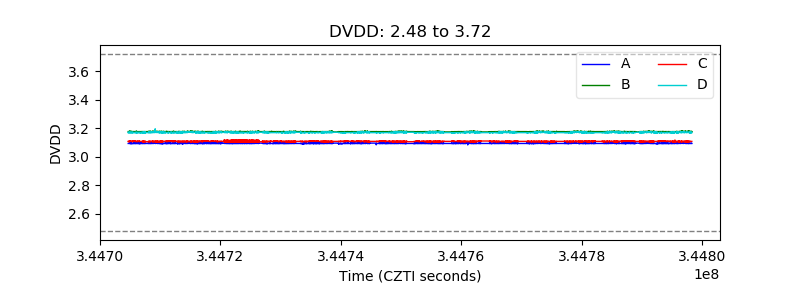 |
| Temperature 1 |  |
| Veto HV Monitor |  |
| Veto LLD |  |
| Alpha Counter | 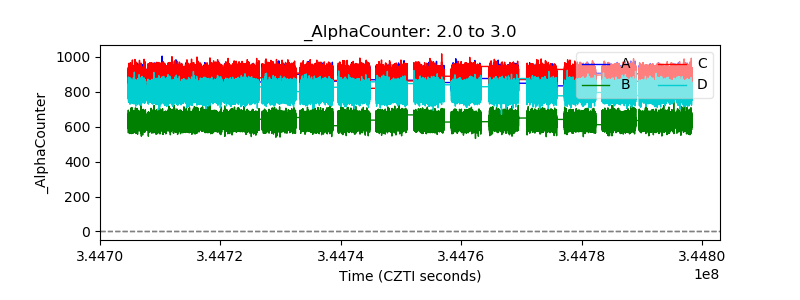 |
| _CPM_Rate |  |
| CZT Counter |  |
| +2.5 Volts monitor |  |
| +5 Volts monitor | 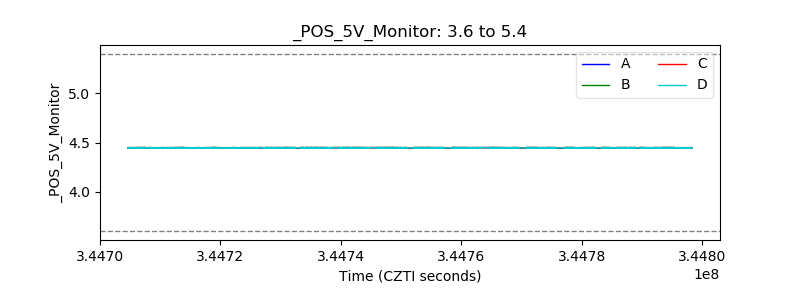 |
| _ROLL_ROT |  |
| _Roll_DEC |  |
| _Roll_RA |  |
| Veto Counter |  |