| Param | Original file | Final file |
|---|---|---|
| Filename | modeM0/AS1A10_045T01_9000004046cztM0_level2_bc.evt | modeM0/AS1A10_045T01_9000004046cztM0_level2_quad_clean.evt |
| Size (bytes) | 1,115,565,120 | 320,048,640 |
| Size | 1.0 GB | 305.2 MB |
| Events in quadrant A | 5,787,752 | 2,086,672 |
| Events in quadrant B | 5,923,834 | 2,066,775 |
| Events in quadrant C | 6,442,443 | 1,945,781 |
| Events in quadrant D | 13,939,042 | 1,888,541 |
| Mode SS | |||
|---|---|---|---|
| Quadrant | BADHDUFLAG | Total packets | Discarded packets |
| A | 0 | 504 | 0 |
| B | 0 | 504 | 0 |
| C | 0 | 504 | 0 |
| D | 0 | 504 | 0 |
| Mode M9 | |||
|---|---|---|---|
| Quadrant | BADHDUFLAG | Total packets | Discarded packets |
| A | 0 | 45 | 0 |
| B | 0 | 45 | 0 |
| C | 0 | 45 | 0 |
| D | 0 | 45 | 0 |
| Mode M0 | |||
|---|---|---|---|
| Quadrant | BADHDUFLAG | Total packets | Discarded packets |
| A | 0 | 52500 | 0 |
| B | 0 | 53555 | 0 |
| C | 0 | 57153 | 0 |
| D | 0 | 80812 | 0 |
| Quadrant | Total seconds | Saturated seconds | Saturation percentage |
|---|---|---|---|
| A | 24798 | 134 | 0.540366% |
| B | 24798 | 232 | 0.935559% |
| C | 24798 | 418 | 1.685620% |
| D | 24798 | 1594 | 6.427938% |
Noise dominated data is calculated using 1-second bins in cleaned event files. If a bin has >2000 counts, and if more than 50% of those come from <1% of pixels, then it is considered to be noise-dominated and hence unusable.
| Quadrant | # 1 sec bins | Bins with >0 counts | Bins with >2000 counts | High rate bins dominated by noise | Noise dominated (total time) | Noise dominated (detector-on time) | Marked lightcurve |
|---|---|---|---|---|---|---|---|
| A | 29328 | 24796 | 0 | 0 | 0.00% | 0.00% |  |
| B | 29328 | 24795 | 4 | 4 | 0.01% | 0.02% |  |
| C | 29328 | 24794 | 14 | 14 | 0.05% | 0.06% |  |
| D | 29328 | 24796 | 519 | 519 | 1.77% | 2.09% |  |
Top three noisy pixels from each quadrant. If the there are fewer than three noisy pixels in the level2.evt file, extra rows are filled as -1
| Pixel properties | Quadrant properties | ||||||
|---|---|---|---|---|---|---|---|
| Quadrant | DetID | PixID | Counts | Sigma | Mean | Median | Sigma |
| A | 0 | 13 | 69016 | 212.59 | 1478 | 1458 | 317.8 |
| A | 13 | 254 | 36758 | 111.08 | 1478 | 1458 | 317.8 |
| A | 8 | 192 | 17293 | 49.83 | 1478 | 1458 | 317.8 |
| B | 10 | 245 | 189612 | 694.14 | 1473 | 1442 | 271.1 |
| B | 0 | 190 | 27716 | 96.92 | 1473 | 1442 | 271.1 |
| B | 0 | 230 | 24936 | 86.66 | 1473 | 1442 | 271.1 |
| C | 3 | 233 | 946300 | 2945.63 | 1382 | 1378 | 320.8 |
| C | 2 | 16 | 175233 | 541.96 | 1382 | 1378 | 320.8 |
| C | 13 | 61 | 8038 | 20.76 | 1382 | 1378 | 320.8 |
| D | 1 | 52 | 5025849 | 16053.56 | 1388 | 1353 | 313.0 |
| D | 8 | 195 | 2907782 | 9286.21 | 1388 | 1353 | 313.0 |
| D | 7 | 80 | 383510 | 1221.01 | 1388 | 1353 | 313.0 |
Histogram calculated using DETX and DETY for each event in the final _common_clean file
| Quadrant A |  |
 |
Quadrant B |
|---|---|---|---|
| Quadrant D |  |
 |
Quadrant C |
| Plot type | Count rate plots | Images |
|---|---|---|
| Comparison with Poisson distribution Blue bars denote a histogram of data divided into 1 sec bins. Red curve is a Poisson curve with rate = median count rate of data. |
 |
 |
| Quadrant-wise count rates Data is divided into 100 sec bins |
 |
|
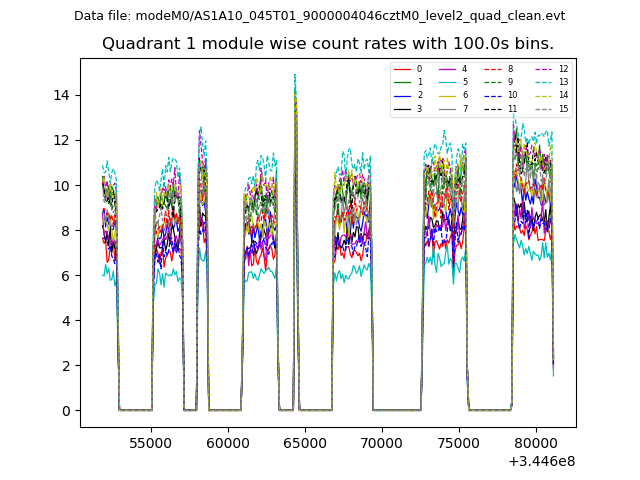
| Module-wise count rates for Quadrant A Data is divided into 100 sec bins |
 |
 |
| Module-wise count rates for Quadrant B Data is divided into 100 sec bins |
 |
 |
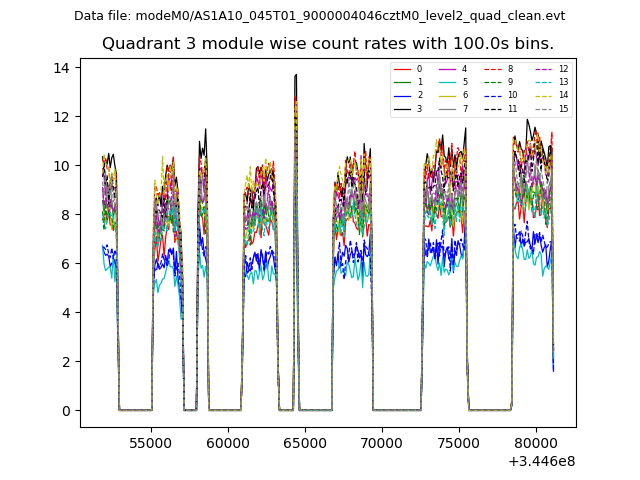
| Module-wise count rates for Quadrant C Data is divided into 100 sec bins |
 |
 |
| Module-wise count rates for Quadrant D Data is divided into 100 sec bins |
 |
 |
| Parameter | Plot |
|---|---|
| CZT HV Monitor | 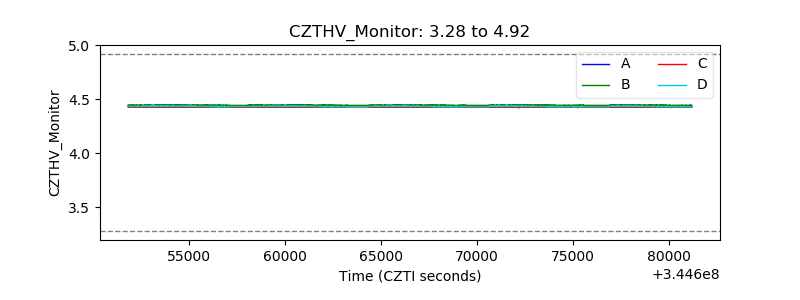 |
| D_VDD |  |
| Temperature 1 |  |
| Veto HV Monitor |  |
| Veto LLD |  |
| Alpha Counter |  |
| _CPM_Rate |  |
| CZT Counter |  |
| +2.5 Volts monitor |  |
| +5 Volts monitor |  |
| _ROLL_ROT |  |
| _Roll_DEC |  |
| _Roll_RA |  |
| Veto Counter |  |