| Param | Original file | Final file |
|---|---|---|
| Filename | modeM0/AS1A10_021T01_9000004044cztM0_level2_bc.evt | modeM0/AS1A10_021T01_9000004044cztM0_level2_quad_clean.evt |
| Size (bytes) | 952,885,440 | 303,690,240 |
| Size | 908.7 MB | 289.6 MB |
| Events in quadrant A | 5,072,868 | 1,939,383 |
| Events in quadrant B | 5,079,462 | 1,936,312 |
| Events in quadrant C | 5,184,362 | 1,835,967 |
| Events in quadrant D | 11,824,738 | 1,778,166 |
| Mode M9 | |||
|---|---|---|---|
| Quadrant | BADHDUFLAG | Total packets | Discarded packets |
| A | 0 | 15 | 0 |
| B | 0 | 15 | 0 |
| C | 0 | 15 | 0 |
| D | 0 | 15 | 0 |
| Mode SS | |||
|---|---|---|---|
| Quadrant | BADHDUFLAG | Total packets | Discarded packets |
| A | 0 | 508 | 0 |
| B | 0 | 508 | 0 |
| C | 0 | 508 | 0 |
| D | 0 | 508 | 0 |
| Mode M0 | |||
|---|---|---|---|
| Quadrant | BADHDUFLAG | Total packets | Discarded packets |
| A | 0 | 51371 | 0 |
| B | 0 | 51767 | 0 |
| C | 0 | 53022 | 0 |
| D | 0 | 73359 | 0 |
| Quadrant | Total seconds | Saturated seconds | Saturation percentage |
|---|---|---|---|
| A | 24831 | 220 | 0.885989% |
| B | 24831 | 370 | 1.490073% |
| C | 24831 | 442 | 1.780033% |
| D | 24831 | 1372 | 5.525351% |
Noise dominated data is calculated using 1-second bins in cleaned event files. If a bin has >2000 counts, and if more than 50% of those come from <1% of pixels, then it is considered to be noise-dominated and hence unusable.
| Quadrant | # 1 sec bins | Bins with >0 counts | Bins with >2000 counts | High rate bins dominated by noise | Noise dominated (total time) | Noise dominated (detector-on time) | Marked lightcurve |
|---|---|---|---|---|---|---|---|
| A | 26131 | 24832 | 0 | 0 | 0.00% | 0.00% |  |
| B | 26130 | 24827 | 1 | 1 | 0.00% | 0.00% |  |
| C | 26130 | 24830 | 2 | 2 | 0.01% | 0.01% | 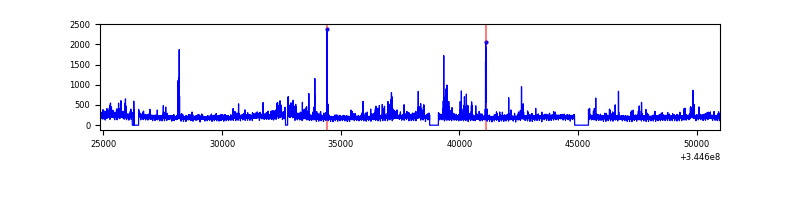 |
| D | 26131 | 24831 | 368 | 368 | 1.41% | 1.48% | 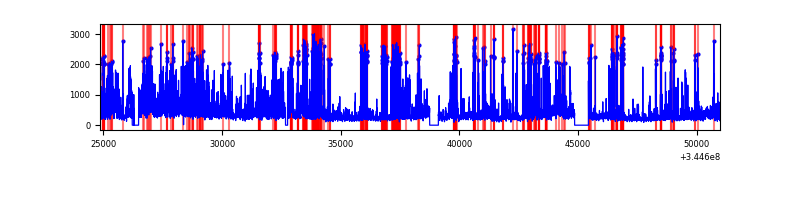 |
Top three noisy pixels from each quadrant. If the there are fewer than three noisy pixels in the level2.evt file, extra rows are filled as -1
| Pixel properties | Quadrant properties | ||||||
|---|---|---|---|---|---|---|---|
| Quadrant | DetID | PixID | Counts | Sigma | Mean | Median | Sigma |
| A | 0 | 13 | 43237 | 146.26 | 1296 | 1269 | 287.0 |
| A | 13 | 254 | 36871 | 124.07 | 1296 | 1269 | 287.0 |
| A | 8 | 192 | 14359 | 45.62 | 1296 | 1269 | 287.0 |
| B | 0 | 190 | 32226 | 123.28 | 1300 | 1264 | 251.2 |
| B | 4 | 200 | 29770 | 113.5 | 1300 | 1264 | 251.2 |
| B | 10 | 245 | 18590 | 68.98 | 1300 | 1264 | 251.2 |
| C | 3 | 233 | 283508 | 969.62 | 1239 | 1234 | 291.1 |
| C | 2 | 16 | 105505 | 358.18 | 1239 | 1234 | 291.1 |
| C | 10 | 22 | 33845 | 112.02 | 1239 | 1234 | 291.1 |
| D | 1 | 52 | 3363445 | 11554.74 | 1246 | 1199 | 291.0 |
| D | 8 | 195 | 2233188 | 7670.49 | 1246 | 1199 | 291.0 |
| D | 7 | 80 | 1176437 | 4038.84 | 1246 | 1199 | 291.0 |
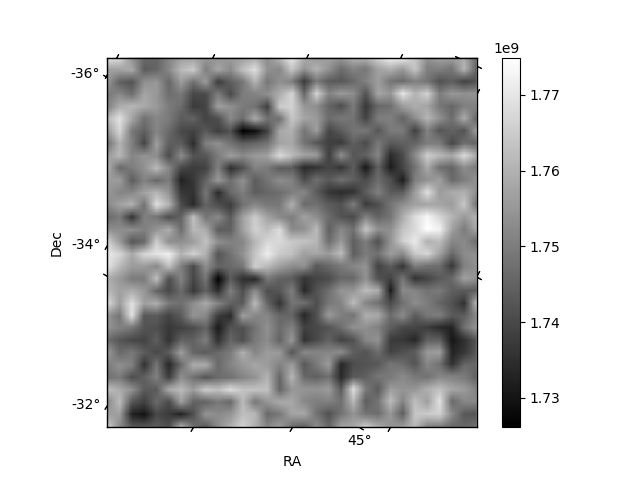
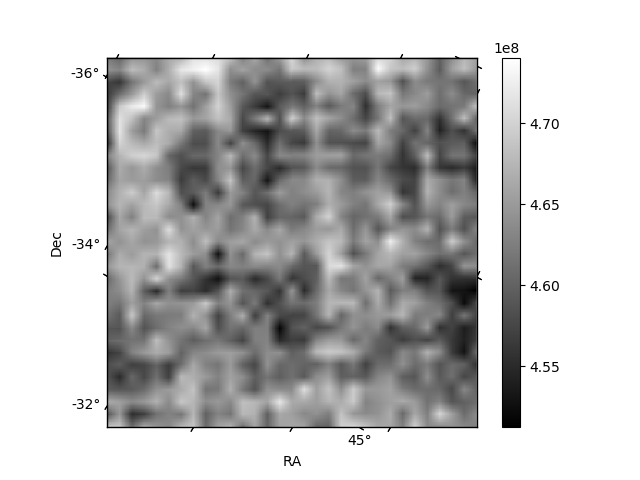
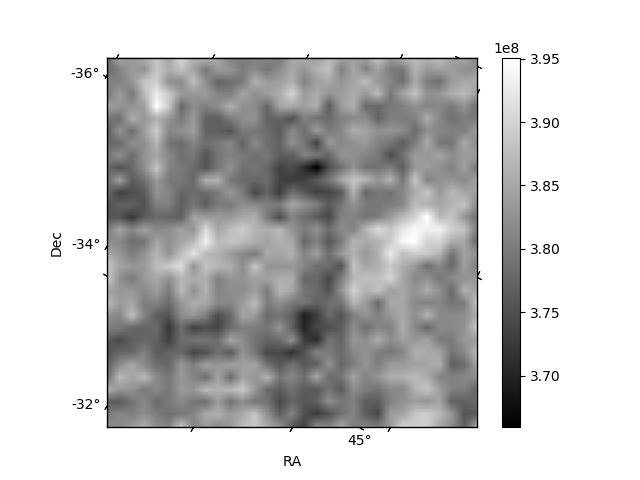
Histogram calculated using DETX and DETY for each event in the final _common_clean file
| Quadrant A |  |
 |
Quadrant B |
|---|---|---|---|
| Quadrant D |  |
 |
Quadrant C |
| Plot type | Count rate plots | Images |
|---|---|---|
| Comparison with Poisson distribution Blue bars denote a histogram of data divided into 1 sec bins. Red curve is a Poisson curve with rate = median count rate of data. |
 |
 |
| Quadrant-wise count rates Data is divided into 100 sec bins |
 |
|
| Module-wise count rates for Quadrant A Data is divided into 100 sec bins |
 |
 |
| Module-wise count rates for Quadrant B Data is divided into 100 sec bins |
 |
 |
| Module-wise count rates for Quadrant C Data is divided into 100 sec bins |
 |
 |
| Module-wise count rates for Quadrant D Data is divided into 100 sec bins |
 |
 |
| Parameter | Plot |
|---|---|
| CZT HV Monitor |  |
| D_VDD |  |
| Temperature 1 |  |
| Veto HV Monitor |  |
| Veto LLD |  |
| Alpha Counter |  |
| _CPM_Rate |  |
| CZT Counter | 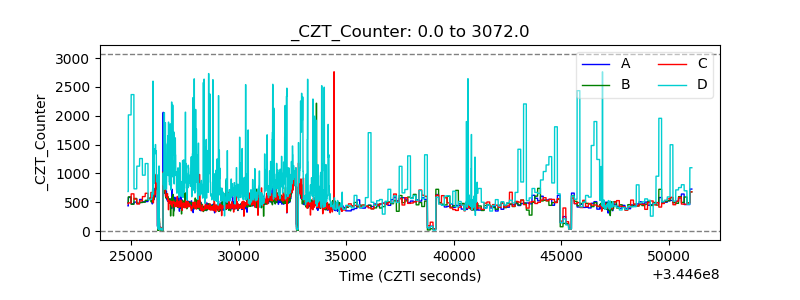 |
| +2.5 Volts monitor |  |
| +5 Volts monitor |  |
| _ROLL_ROT |  |
| _Roll_DEC |  |
| _Roll_RA | 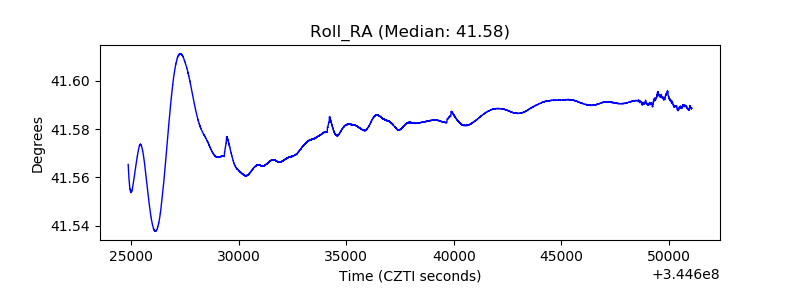 |
| Veto Counter |  |