| Param | Original file | Final file |
|---|---|---|
| Filename | modeM0/AS1A10_021T08_9000004042cztM0_level2_bc.evt | modeM0/AS1A10_021T08_9000004042cztM0_level2_quad_clean.evt |
| Size (bytes) | 1,516,665,600 | 459,112,320 |
| Size | 1.4 GB | 437.8 MB |
| Events in quadrant A | 7,678,619 | 2,968,163 |
| Events in quadrant B | 8,186,285 | 3,017,621 |
| Events in quadrant C | 7,868,002 | 2,867,730 |
| Events in quadrant D | 19,782,997 | 2,625,200 |
| Mode M0 | |||
|---|---|---|---|
| Quadrant | BADHDUFLAG | Total packets | Discarded packets |
| A | 0 | 74216 | 0 |
| B | 0 | 76699 | 0 |
| C | 0 | 76555 | 0 |
| D | 0 | 119976 | 0 |
| Mode M9 | |||
|---|---|---|---|
| Quadrant | BADHDUFLAG | Total packets | Discarded packets |
| A | 0 | 49 | 0 |
| B | 0 | 48 | 0 |
| C | 0 | 48 | 0 |
| D | 0 | 49 | 0 |
| Mode SS | |||
|---|---|---|---|
| Quadrant | BADHDUFLAG | Total packets | Discarded packets |
| A | 0 | 727 | 0 |
| B | 0 | 728 | 0 |
| C | 0 | 726 | 0 |
| D | 0 | 726 | 0 |
| Quadrant | Total seconds | Saturated seconds | Saturation percentage |
|---|---|---|---|
| A | 35328 | 579 | 1.638927% |
| B | 35335 | 853 | 2.414037% |
| C | 35320 | 948 | 2.684032% |
| D | 35278 | 4864 | 13.787630% |
Noise dominated data is calculated using 1-second bins in cleaned event files. If a bin has >2000 counts, and if more than 50% of those come from <1% of pixels, then it is considered to be noise-dominated and hence unusable.
| Quadrant | # 1 sec bins | Bins with >0 counts | Bins with >2000 counts | High rate bins dominated by noise | Noise dominated (total time) | Noise dominated (detector-on time) | Marked lightcurve |
|---|---|---|---|---|---|---|---|
| A | 45813 | 33670 | 0 | 0 | 0.00% | 0.00% |  |
| B | 45813 | 33660 | 17 | 17 | 0.04% | 0.05% |  |
| C | 45813 | 33660 | 0 | 0 | 0.00% | 0.00% |  |
| D | 45811 | 33609 | 1490 | 1490 | 3.25% | 4.43% |  |
Top three noisy pixels from each quadrant. If the there are fewer than three noisy pixels in the level2.evt file, extra rows are filled as -1
| Pixel properties | Quadrant properties | ||||||
|---|---|---|---|---|---|---|---|
| Quadrant | DetID | PixID | Counts | Sigma | Mean | Median | Sigma |
| A | 0 | 13 | 345405 | 838.93 | 1887 | 1852 | 409.5 |
| A | 13 | 254 | 50644 | 119.15 | 1887 | 1852 | 409.5 |
| A | 8 | 192 | 27792 | 63.34 | 1887 | 1852 | 409.5 |
| B | 10 | 245 | 533214 | 1482.47 | 1896 | 1848 | 358.4 |
| B | 15 | 32 | 80502 | 219.44 | 1896 | 1848 | 358.4 |
| B | 0 | 190 | 80153 | 218.47 | 1896 | 1848 | 358.4 |
| C | 3 | 233 | 516294 | 1219.01 | 1805 | 1795 | 422.1 |
| C | 2 | 16 | 286303 | 674.09 | 1805 | 1795 | 422.1 |
| C | 15 | 208 | 127975 | 298.96 | 1805 | 1795 | 422.1 |
| D | 1 | 52 | 7295866 | 18439.14 | 1716 | 1661 | 395.6 |
| D | 8 | 195 | 3522772 | 8901.07 | 1716 | 1661 | 395.6 |
| D | 7 | 80 | 1266504 | 3197.42 | 1716 | 1661 | 395.6 |
Histogram calculated using DETX and DETY for each event in the final _common_clean file
| Quadrant A | 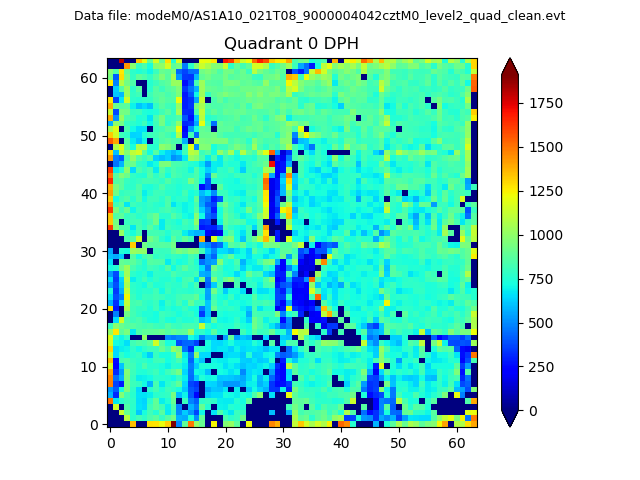 |
 |
Quadrant B |
|---|---|---|---|
| Quadrant D |  |
 |
Quadrant C |
| Plot type | Count rate plots | Images |
|---|---|---|
| Comparison with Poisson distribution Blue bars denote a histogram of data divided into 1 sec bins. Red curve is a Poisson curve with rate = median count rate of data. |
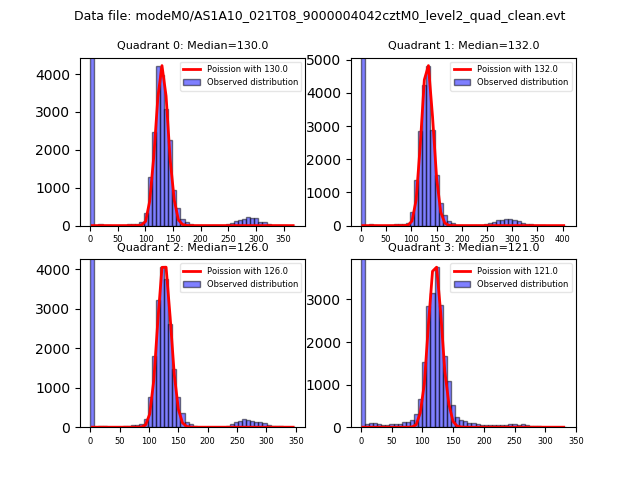 |
 |
| Quadrant-wise count rates Data is divided into 100 sec bins |
 |
|
| Module-wise count rates for Quadrant A Data is divided into 100 sec bins |
 |
 |
| Module-wise count rates for Quadrant B Data is divided into 100 sec bins |
 |
 |
| Module-wise count rates for Quadrant C Data is divided into 100 sec bins |
 |
 |
| Module-wise count rates for Quadrant D Data is divided into 100 sec bins |
 |
 |
| Parameter | Plot |
|---|---|
| CZT HV Monitor |  |
| D_VDD |  |
| Temperature 1 |  |
| Veto HV Monitor |  |
| Veto LLD |  |
| Alpha Counter |  |
| _CPM_Rate |  |
| CZT Counter |  |
| +2.5 Volts monitor |  |
| +5 Volts monitor |  |
| _ROLL_ROT |  |
| _Roll_DEC |  |
| _Roll_RA |  |
| Veto Counter |  |