| Param | Original file | Final file |
|---|---|---|
| Filename | modeM0/AS1A10_065T03_9000004040cztM0_level2_bc.evt | modeM0/AS1A10_065T03_9000004040cztM0_level2_quad_clean.evt |
| Size (bytes) | 6,170,129,280 | 2,086,724,160 |
| Size | 5.7 GB | 1.9 GB |
| Events in quadrant A | 36,077,398 | 13,670,602 |
| Events in quadrant B | 35,652,026 | 13,557,098 |
| Events in quadrant C | 37,097,026 | 12,744,589 |
| Events in quadrant D | 67,515,250 | 12,639,883 |
| Mode SS | |||
|---|---|---|---|
| Quadrant | BADHDUFLAG | Total packets | Discarded packets |
| A | 0 | 3154 | 0 |
| B | 0 | 3156 | 0 |
| C | 0 | 3154 | 0 |
| D | 0 | 3154 | 0 |
| Mode M9 | |||
|---|---|---|---|
| Quadrant | BADHDUFLAG | Total packets | Discarded packets |
| A | 0 | 239 | 0 |
| B | 0 | 239 | 0 |
| C | 0 | 239 | 0 |
| D | 0 | 239 | 0 |
| Mode M0 | |||
|---|---|---|---|
| Quadrant | BADHDUFLAG | Total packets | Discarded packets |
| A | 0 | 332122 | 0 |
| B | 0 | 333943 | 0 |
| C | 0 | 345669 | 0 |
| D | 0 | 443072 | 0 |
| Quadrant | Total seconds | Saturated seconds | Saturation percentage |
|---|---|---|---|
| A | 154632 | 2301 | 1.488049% |
| B | 154631 | 2516 | 1.627099% |
| C | 154632 | 3794 | 2.453567% |
| D | 154631 | 7092 | 4.586402% |
Noise dominated data is calculated using 1-second bins in cleaned event files. If a bin has >2000 counts, and if more than 50% of those come from <1% of pixels, then it is considered to be noise-dominated and hence unusable.
| Quadrant | # 1 sec bins | Bins with >0 counts | Bins with >2000 counts | High rate bins dominated by noise | Noise dominated (total time) | Noise dominated (detector-on time) | Marked lightcurve |
|---|---|---|---|---|---|---|---|
| A | 178962 | 154641 | 449 | 449 | 0.25% | 0.29% |  |
| B | 178962 | 154630 | 31 | 31 | 0.02% | 0.02% | 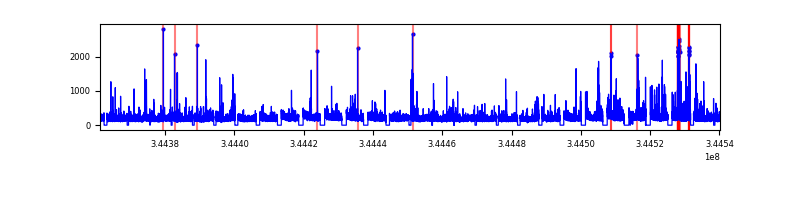 |
| C | 178962 | 154632 | 170 | 170 | 0.09% | 0.11% |  |
| D | 178962 | 154618 | 1142 | 1142 | 0.64% | 0.74% |  |
Top three noisy pixels from each quadrant. If the there are fewer than three noisy pixels in the level2.evt file, extra rows are filled as -1
| Pixel properties | Quadrant properties | ||||||
|---|---|---|---|---|---|---|---|
| Quadrant | DetID | PixID | Counts | Sigma | Mean | Median | Sigma |
| A | 6 | 16 | 1506794 | 793.79 | 8907 | 8769 | 1887.2 |
| A | 13 | 254 | 208402 | 105.78 | 8907 | 8769 | 1887.2 |
| A | 8 | 192 | 125622 | 61.92 | 8907 | 8769 | 1887.2 |
| B | 10 | 245 | 1149421 | 678.48 | 8916 | 8704 | 1681.3 |
| B | 4 | 52 | 123541 | 68.3 | 8916 | 8704 | 1681.3 |
| B | 0 | 230 | 105995 | 57.87 | 8916 | 8704 | 1681.3 |
| C | 2 | 16 | 1962327 | 1002.63 | 8434 | 8435 | 1948.8 |
| C | 3 | 233 | 1520065 | 775.68 | 8434 | 8435 | 1948.8 |
| C | 10 | 22 | 1126770 | 573.87 | 8434 | 8435 | 1948.8 |
| D | 1 | 52 | 19439519 | 10097.9 | 8578 | 8359 | 1924.3 |
| D | 8 | 195 | 10512370 | 5458.68 | 8578 | 8359 | 1924.3 |
| D | 7 | 80 | 3455185 | 1791.23 | 8578 | 8359 | 1924.3 |
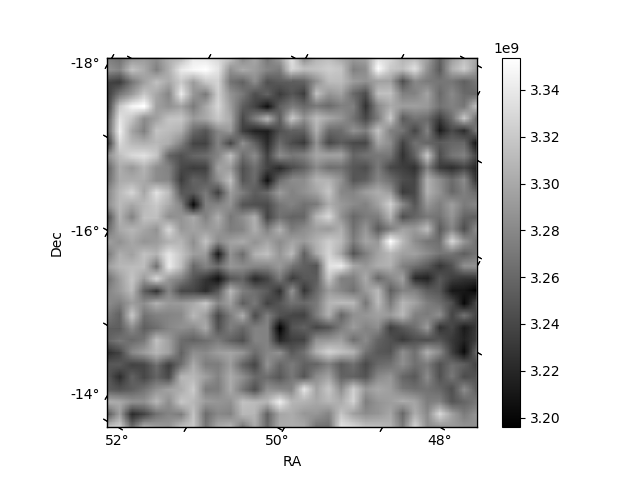
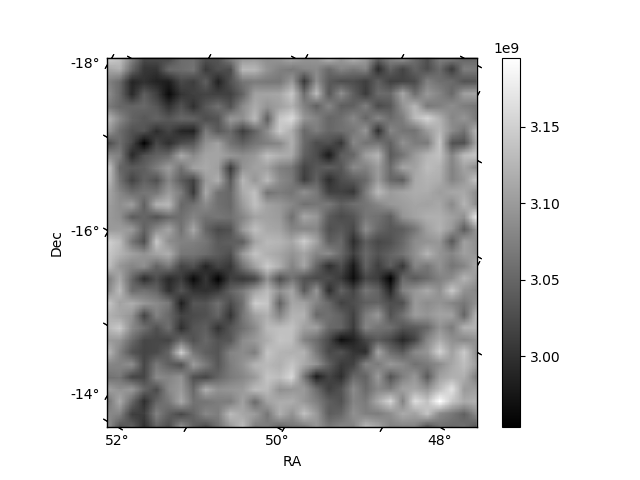
Histogram calculated using DETX and DETY for each event in the final _common_clean file
| Quadrant A |  |
 |
Quadrant B |
|---|---|---|---|
| Quadrant D |  |
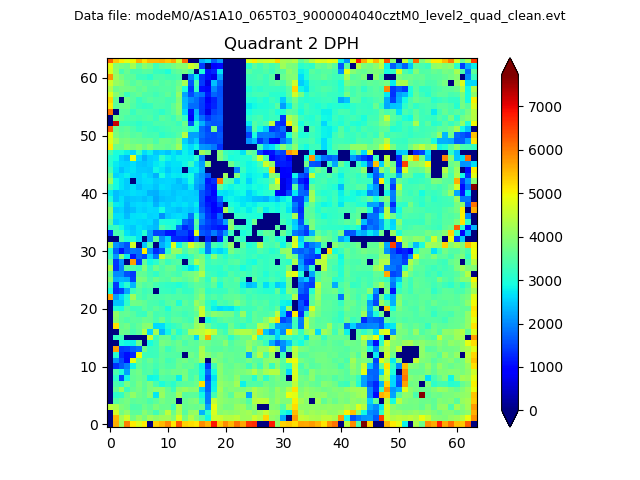 |
Quadrant C |
| Plot type | Count rate plots | Images |
|---|---|---|
| Comparison with Poisson distribution Blue bars denote a histogram of data divided into 1 sec bins. Red curve is a Poisson curve with rate = median count rate of data. |
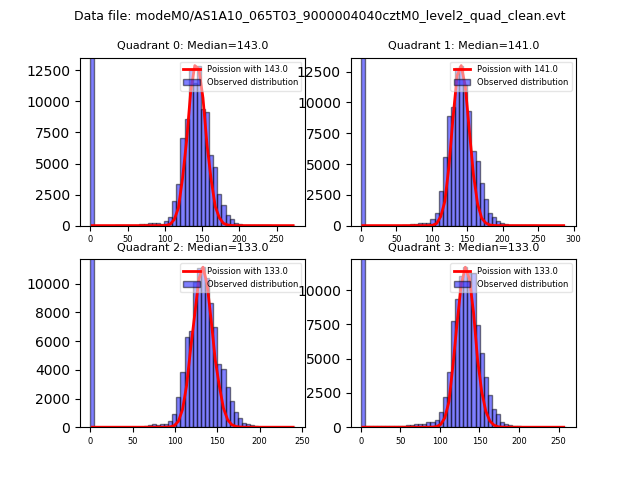 |
 |
| Quadrant-wise count rates Data is divided into 100 sec bins |
 |
|
| Module-wise count rates for Quadrant A Data is divided into 100 sec bins |
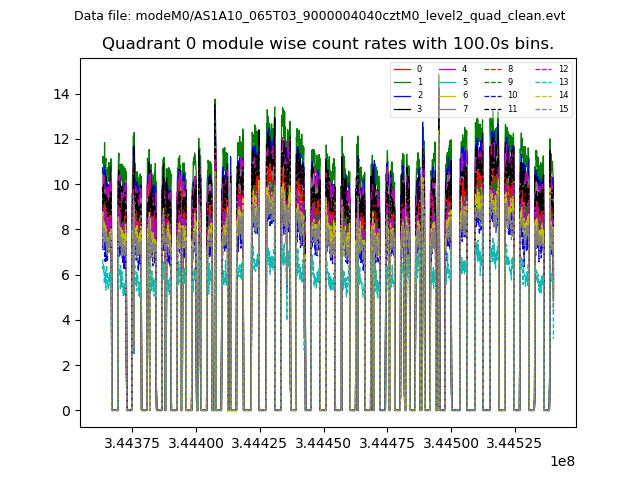 |
 |
| Module-wise count rates for Quadrant B Data is divided into 100 sec bins |
 |
 |
| Module-wise count rates for Quadrant C Data is divided into 100 sec bins |
 |
 |
| Module-wise count rates for Quadrant D Data is divided into 100 sec bins |
 |
 |
| Parameter | Plot |
|---|---|
| CZT HV Monitor | 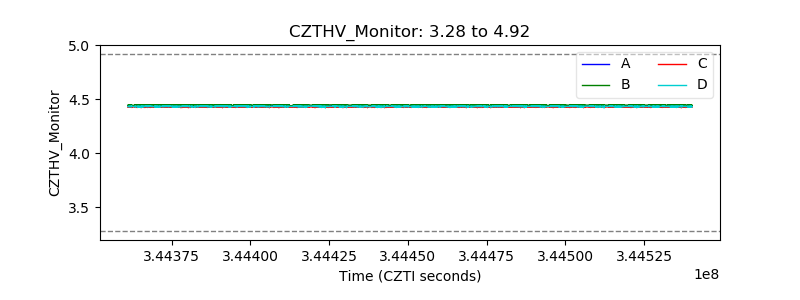 |
| D_VDD |  |
| Temperature 1 |  |
| Veto HV Monitor |  |
| Veto LLD |  |
| Alpha Counter |  |
| _CPM_Rate |  |
| CZT Counter |  |
| +2.5 Volts monitor | 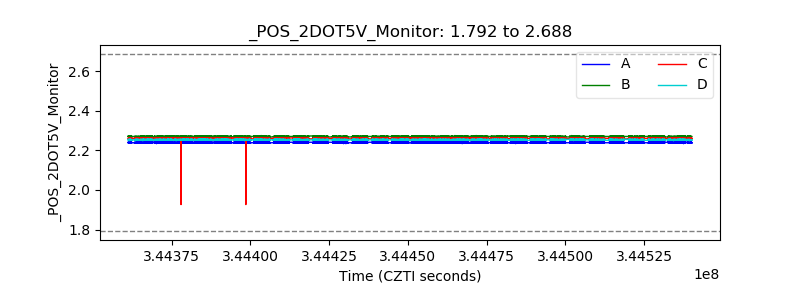 |
| +5 Volts monitor |  |
| _ROLL_ROT |  |
| _Roll_DEC |  |
| _Roll_RA |  |
| Veto Counter |  |