| Param | Original file | Final file |
|---|---|---|
| Filename | modeM0/AS1A10_021T03_9000004038cztM0_level2_bc.evt | modeM0/AS1A10_021T03_9000004038cztM0_level2_quad_clean.evt |
| Size (bytes) | 1,614,366,720 | 418,654,080 |
| Size | 1.5 GB | 399.3 MB |
| Events in quadrant A | 7,893,900 | 2,687,604 |
| Events in quadrant B | 9,656,964 | 2,699,138 |
| Events in quadrant C | 8,083,639 | 2,607,114 |
| Events in quadrant D | 21,011,693 | 2,421,900 |
| Mode M0 | |||
|---|---|---|---|
| Quadrant | BADHDUFLAG | Total packets | Discarded packets |
| A | 0 | 70631 | 0 |
| B | 0 | 78013 | 0 |
| C | 0 | 73394 | 0 |
| D | 0 | 124648 | 0 |
| Mode M9 | |||
|---|---|---|---|
| Quadrant | BADHDUFLAG | Total packets | Discarded packets |
| A | 0 | 73 | 0 |
| B | 0 | 73 | 0 |
| C | 0 | 73 | 0 |
| D | 0 | 73 | 0 |
| Mode SS | |||
|---|---|---|---|
| Quadrant | BADHDUFLAG | Total packets | Discarded packets |
| A | 0 | 672 | 0 |
| B | 0 | 672 | 0 |
| C | 0 | 672 | 0 |
| D | 0 | 672 | 0 |
| Quadrant | Total seconds | Saturated seconds | Saturation percentage |
|---|---|---|---|
| A | 32944 | 456 | 1.384167% |
| B | 32944 | 570 | 1.730209% |
| C | 32945 | 671 | 2.036728% |
| D | 32945 | 4167 | 12.648353% |
Noise dominated data is calculated using 1-second bins in cleaned event files. If a bin has >2000 counts, and if more than 50% of those come from <1% of pixels, then it is considered to be noise-dominated and hence unusable.
| Quadrant | # 1 sec bins | Bins with >0 counts | Bins with >2000 counts | High rate bins dominated by noise | Noise dominated (total time) | Noise dominated (detector-on time) | Marked lightcurve |
|---|---|---|---|---|---|---|---|
| A | 40224 | 32938 | 2 | 2 | 0.00% | 0.01% |  |
| B | 40224 | 32938 | 3 | 3 | 0.01% | 0.01% |  |
| C | 40225 | 32940 | 1 | 1 | 0.00% | 0.00% |  |
| D | 40225 | 32939 | 376 | 376 | 0.93% | 1.14% |  |
Top three noisy pixels from each quadrant. If the there are fewer than three noisy pixels in the level2.evt file, extra rows are filled as -1
| Pixel properties | Quadrant properties | ||||||
|---|---|---|---|---|---|---|---|
| Quadrant | DetID | PixID | Counts | Sigma | Mean | Median | Sigma |
| A | 13 | 254 | 56460 | 126.96 | 2034 | 2006 | 428.9 |
| A | 8 | 192 | 27169 | 58.67 | 2034 | 2006 | 428.9 |
| A | 0 | 247 | 13920 | 27.78 | 2034 | 2006 | 428.9 |
| B | 10 | 245 | 1591481 | 4319.3 | 2022 | 1985 | 368.0 |
| B | 15 | 32 | 119432 | 319.15 | 2022 | 1985 | 368.0 |
| B | 0 | 190 | 68735 | 181.39 | 2022 | 1985 | 368.0 |
| C | 15 | 208 | 249150 | 547.39 | 1953 | 1956 | 451.6 |
| C | 2 | 16 | 184759 | 404.8 | 1953 | 1956 | 451.6 |
| C | 3 | 233 | 149858 | 327.51 | 1953 | 1956 | 451.6 |
| D | 1 | 52 | 8020726 | 19117.05 | 1893 | 1848 | 419.5 |
| D | 7 | 80 | 2840328 | 6766.95 | 1893 | 1848 | 419.5 |
| D | 8 | 195 | 1153207 | 2744.85 | 1893 | 1848 | 419.5 |
Histogram calculated using DETX and DETY for each event in the final _common_clean file
| Quadrant A |  |
 |
Quadrant B |
|---|---|---|---|
| Quadrant D | 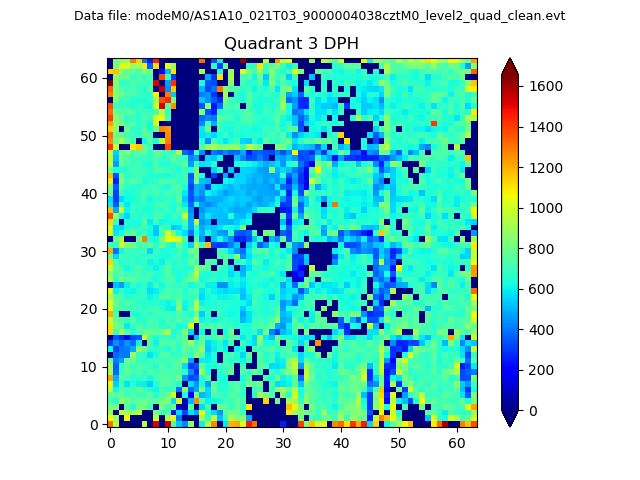 |
 |
Quadrant C |
| Plot type | Count rate plots | Images |
|---|---|---|
| Comparison with Poisson distribution Blue bars denote a histogram of data divided into 1 sec bins. Red curve is a Poisson curve with rate = median count rate of data. |
 |
 |
| Quadrant-wise count rates Data is divided into 100 sec bins |
 |
|
| Module-wise count rates for Quadrant A Data is divided into 100 sec bins |
 |
 |
| Module-wise count rates for Quadrant B Data is divided into 100 sec bins |
 |
 |
| Module-wise count rates for Quadrant C Data is divided into 100 sec bins |
 |
 |
| Module-wise count rates for Quadrant D Data is divided into 100 sec bins |
 |
 |
| Parameter | Plot |
|---|---|
| CZT HV Monitor |  |
| D_VDD | 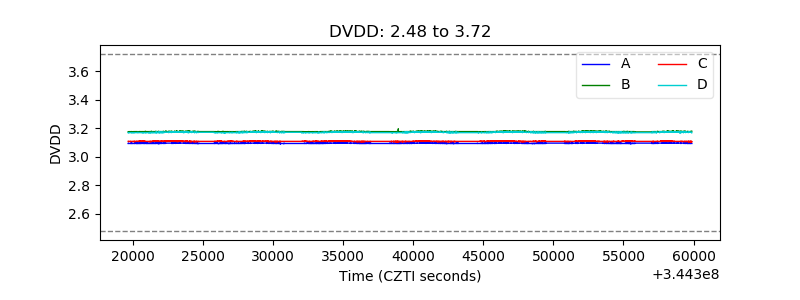 |
| Temperature 1 |  |
| Veto HV Monitor |  |
| Veto LLD | 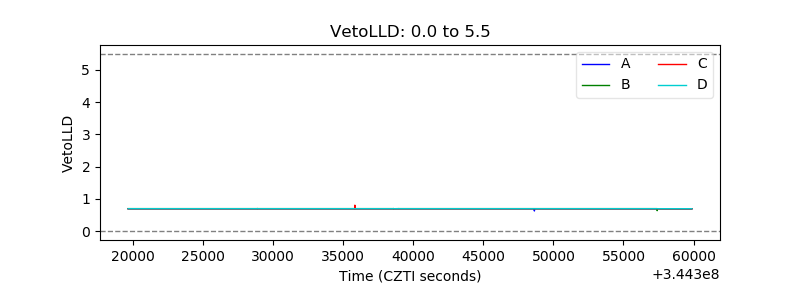 |
| Alpha Counter |  |
| _CPM_Rate |  |
| CZT Counter |  |
| +2.5 Volts monitor |  |
| +5 Volts monitor |  |
| _ROLL_ROT |  |
| _Roll_DEC |  |
| _Roll_RA |  |
| Veto Counter | 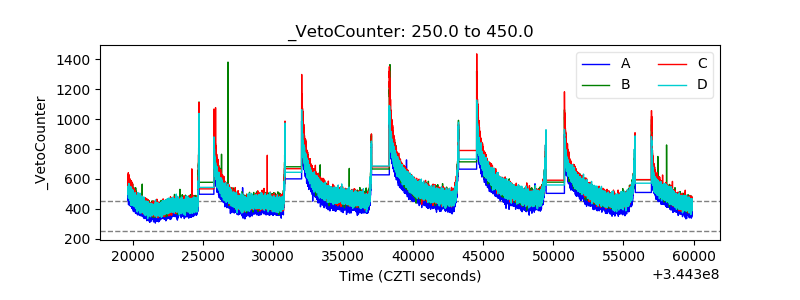 |