| Param | Original file | Final file |
|---|---|---|
| Filename | modeM0/AS1A10_021T02_9000004036cztM0_level2_bc.evt | modeM0/AS1A10_021T02_9000004036cztM0_level2_quad_clean.evt |
| Size (bytes) | 1,171,419,840 | 342,443,520 |
| Size | 1.1 GB | 326.6 MB |
| Events in quadrant A | 5,338,540 | 2,236,316 |
| Events in quadrant B | 7,489,741 | 2,236,393 |
| Events in quadrant C | 5,217,470 | 2,143,659 |
| Events in quadrant D | 15,689,925 | 2,000,074 |
| Mode M0 | |||
|---|---|---|---|
| Quadrant | BADHDUFLAG | Total packets | Discarded packets |
| A | 0 | 52664 | 0 |
| B | 0 | 60339 | 0 |
| C | 0 | 52930 | 0 |
| D | 0 | 87961 | 0 |
| Mode M9 | |||
|---|---|---|---|
| Quadrant | BADHDUFLAG | Total packets | Discarded packets |
| A | 0 | 19 | 0 |
| B | 0 | 19 | 0 |
| C | 0 | 19 | 0 |
| D | 0 | 19 | 0 |
| Mode SS | |||
|---|---|---|---|
| Quadrant | BADHDUFLAG | Total packets | Discarded packets |
| A | 0 | 518 | 0 |
| B | 0 | 518 | 0 |
| C | 0 | 518 | 0 |
| D | 0 | 518 | 0 |
| Quadrant | Total seconds | Saturated seconds | Saturation percentage |
|---|---|---|---|
| A | 25522 | 209 | 0.818901% |
| B | 25522 | 441 | 1.727921% |
| C | 25522 | 323 | 1.265575% |
| D | 25522 | 2370 | 9.286106% |
Noise dominated data is calculated using 1-second bins in cleaned event files. If a bin has >2000 counts, and if more than 50% of those come from <1% of pixels, then it is considered to be noise-dominated and hence unusable.
| Quadrant | # 1 sec bins | Bins with >0 counts | Bins with >2000 counts | High rate bins dominated by noise | Noise dominated (total time) | Noise dominated (detector-on time) | Marked lightcurve |
|---|---|---|---|---|---|---|---|
| A | 27347 | 25522 | 97 | 97 | 0.35% | 0.38% |  |
| B | 27347 | 25520 | 1 | 1 | 0.00% | 0.00% | 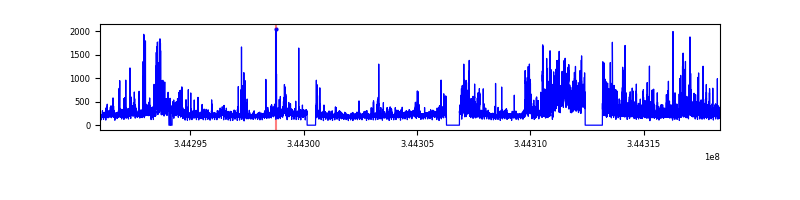 |
| C | 27347 | 25523 | 6 | 6 | 0.02% | 0.02% |  |
| D | 27347 | 25518 | 710 | 710 | 2.60% | 2.78% |  |
Top three noisy pixels from each quadrant. If the there are fewer than three noisy pixels in the level2.evt file, extra rows are filled as -1
| Pixel properties | Quadrant properties | ||||||
|---|---|---|---|---|---|---|---|
| Quadrant | DetID | PixID | Counts | Sigma | Mean | Median | Sigma |
| A | 6 | 16 | 258075 | 891.02 | 1308 | 1285 | 288.2 |
| A | 13 | 254 | 40734 | 136.88 | 1308 | 1285 | 288.2 |
| A | 8 | 192 | 18430 | 59.49 | 1308 | 1285 | 288.2 |
| B | 10 | 245 | 2089468 | 8288.75 | 1314 | 1280 | 251.9 |
| B | 5 | 172 | 125392 | 492.64 | 1314 | 1280 | 251.9 |
| B | 0 | 230 | 68382 | 266.35 | 1314 | 1280 | 251.9 |
| C | 2 | 16 | 181677 | 596.65 | 1264 | 1257 | 302.4 |
| C | 15 | 208 | 68836 | 223.49 | 1264 | 1257 | 302.4 |
| C | 10 | 22 | 58119 | 188.04 | 1264 | 1257 | 302.4 |
| D | 1 | 52 | 5549745 | 18940.67 | 1244 | 1203 | 292.9 |
| D | 7 | 80 | 2909624 | 9928.27 | 1244 | 1203 | 292.9 |
| D | 8 | 195 | 1136450 | 3875.31 | 1244 | 1203 | 292.9 |
Histogram calculated using DETX and DETY for each event in the final _common_clean file
| Quadrant A | 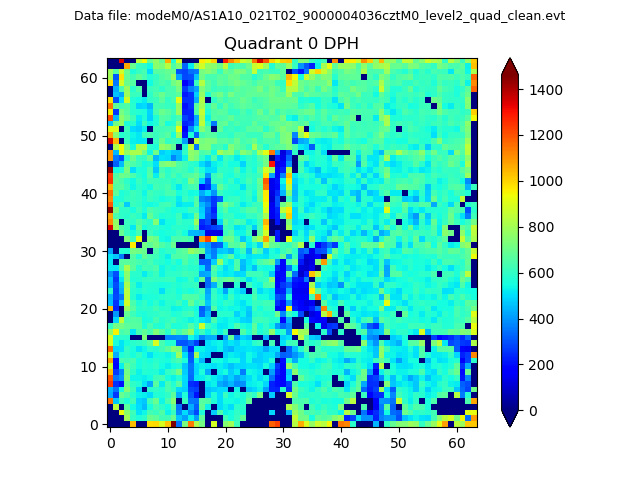 |
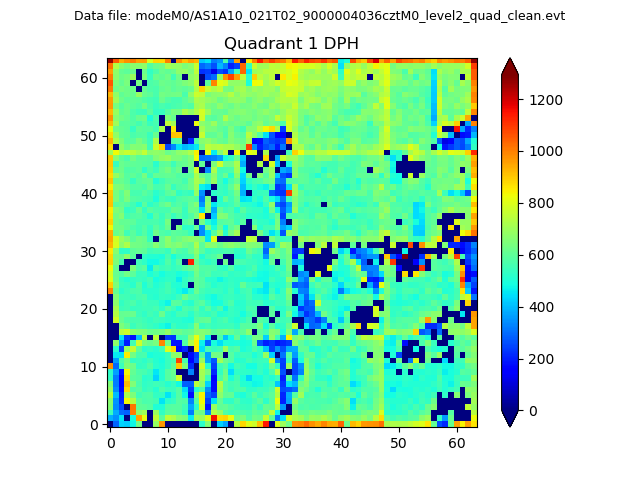 |
Quadrant B |
|---|---|---|---|
| Quadrant D |  |
 |
Quadrant C |
| Plot type | Count rate plots | Images |
|---|---|---|
| Comparison with Poisson distribution Blue bars denote a histogram of data divided into 1 sec bins. Red curve is a Poisson curve with rate = median count rate of data. |
 |
 |
| Quadrant-wise count rates Data is divided into 100 sec bins |
 |
|
| Module-wise count rates for Quadrant A Data is divided into 100 sec bins |
 |
 |
| Module-wise count rates for Quadrant B Data is divided into 100 sec bins |
 |
 |
| Module-wise count rates for Quadrant C Data is divided into 100 sec bins |
 |
 |
| Module-wise count rates for Quadrant D Data is divided into 100 sec bins |
 |
 |
| Parameter | Plot |
|---|---|
| CZT HV Monitor |  |
| D_VDD |  |
| Temperature 1 | 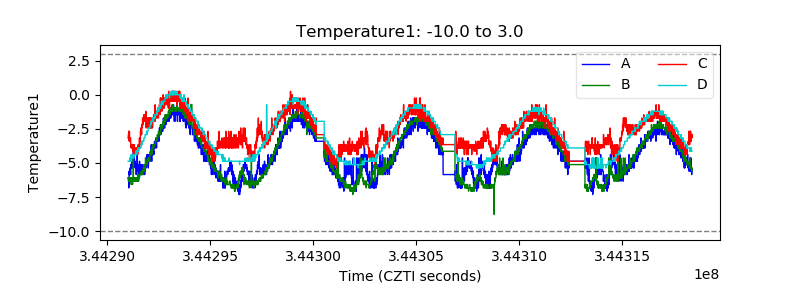 |
| Veto HV Monitor |  |
| Veto LLD | 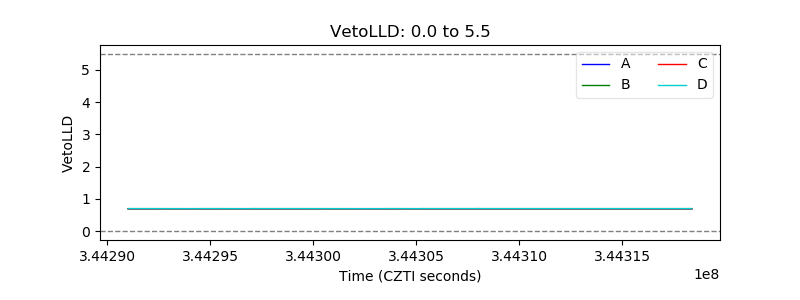 |
| Alpha Counter |  |
| _CPM_Rate |  |
| CZT Counter |  |
| +2.5 Volts monitor |  |
| +5 Volts monitor | 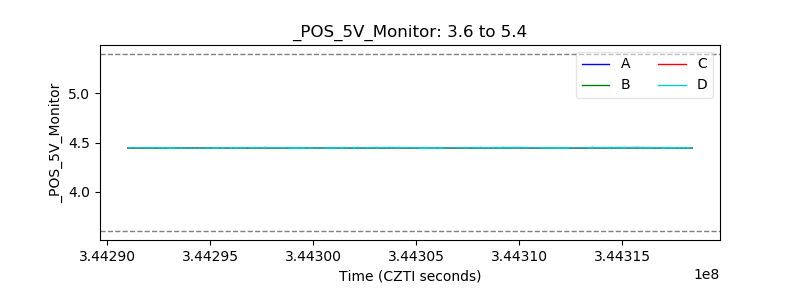 |
| _ROLL_ROT |  |
| _Roll_DEC |  |
| _Roll_RA | 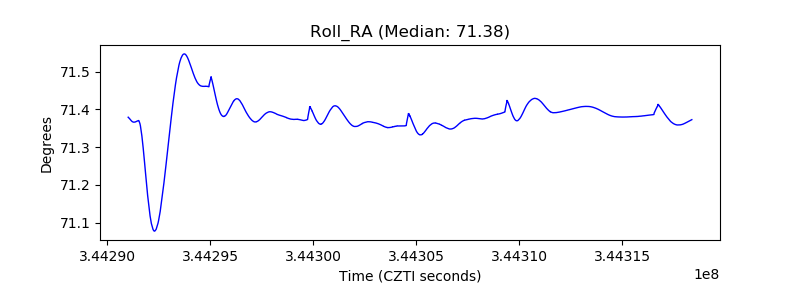 |
| Veto Counter |  |