| Param | Original file | Final file |
|---|---|---|
| Filename | modeM0/AS1A10_016T01_9000004034cztM0_level2_bc.evt | modeM0/AS1A10_016T01_9000004034cztM0_level2_quad_clean.evt |
| Size (bytes) | 4,315,406,400 | 1,142,179,200 |
| Size | 4.0 GB | 1.1 GB |
| Events in quadrant A | 20,198,189 | 7,359,783 |
| Events in quadrant B | 23,536,330 | 7,418,397 |
| Events in quadrant C | 22,407,896 | 7,093,665 |
| Events in quadrant D | 58,409,494 | 6,536,854 |
| Mode M0 | |||
|---|---|---|---|
| Quadrant | BADHDUFLAG | Total packets | Discarded packets |
| A | 0 | 190941 | 0 |
| B | 0 | 204506 | 0 |
| C | 0 | 203793 | 0 |
| D | 0 | 341873 | 0 |
| Mode SS | |||
|---|---|---|---|
| Quadrant | BADHDUFLAG | Total packets | Discarded packets |
| A | 0 | 1838 | 0 |
| B | 0 | 1836 | 0 |
| C | 0 | 1838 | 0 |
| D | 0 | 1840 | 0 |
| Mode M9 | |||
|---|---|---|---|
| Quadrant | BADHDUFLAG | Total packets | Discarded packets |
| A | 0 | 157 | 0 |
| B | 0 | 157 | 0 |
| C | 0 | 157 | 0 |
| D | 0 | 157 | 0 |
| Quadrant | Total seconds | Saturated seconds | Saturation percentage |
|---|---|---|---|
| A | 90233 | 1204 | 1.334323% |
| B | 90217 | 1740 | 1.928683% |
| C | 90198 | 2557 | 2.834874% |
| D | 90229 | 14112 | 15.640204% |
Noise dominated data is calculated using 1-second bins in cleaned event files. If a bin has >2000 counts, and if more than 50% of those come from <1% of pixels, then it is considered to be noise-dominated and hence unusable.
| Quadrant | # 1 sec bins | Bins with >0 counts | Bins with >2000 counts | High rate bins dominated by noise | Noise dominated (total time) | Noise dominated (detector-on time) | Marked lightcurve |
|---|---|---|---|---|---|---|---|
| A | 101875 | 88635 | 2 | 2 | 0.00% | 0.00% |  |
| B | 101875 | 88632 | 6 | 6 | 0.01% | 0.01% |  |
| C | 101876 | 88636 | 136 | 136 | 0.13% | 0.15% |  |
| D | 101876 | 88635 | 2483 | 2483 | 2.44% | 2.80% |  |
Top three noisy pixels from each quadrant. If the there are fewer than three noisy pixels in the level2.evt file, extra rows are filled as -1
| Pixel properties | Quadrant properties | ||||||
|---|---|---|---|---|---|---|---|
| Quadrant | DetID | PixID | Counts | Sigma | Mean | Median | Sigma |
| A | 13 | 254 | 140112 | 119.91 | 5202 | 5119 | 1125.8 |
| A | 15 | 174 | 42495 | 33.2 | 5202 | 5119 | 1125.8 |
| A | 0 | 13 | 38837 | 29.95 | 5202 | 5119 | 1125.8 |
| B | 10 | 245 | 2230652 | 2318.02 | 5187 | 5074 | 960.1 |
| B | 0 | 230 | 653397 | 675.25 | 5187 | 5074 | 960.1 |
| B | 15 | 32 | 222388 | 226.34 | 5187 | 5074 | 960.1 |
| C | 3 | 233 | 1753462 | 1515.39 | 4966 | 4951 | 1153.8 |
| C | 2 | 16 | 1304474 | 1126.27 | 4966 | 4951 | 1153.8 |
| C | 6 | 112 | 83651 | 68.21 | 4966 | 4951 | 1153.8 |
| D | 1 | 52 | 17866142 | 16201.46 | 4780 | 4631 | 1102.5 |
| D | 7 | 80 | 8851839 | 8024.95 | 4780 | 4631 | 1102.5 |
| D | 8 | 195 | 8062572 | 7309.03 | 4780 | 4631 | 1102.5 |
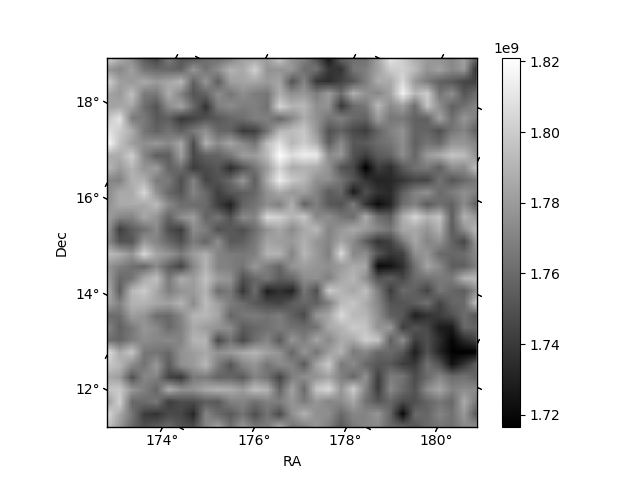
Histogram calculated using DETX and DETY for each event in the final _common_clean file
| Quadrant A |  |
 |
Quadrant B |
|---|---|---|---|
| Quadrant D |  |
 |
Quadrant C |
| Plot type | Count rate plots | Images |
|---|---|---|
| Comparison with Poisson distribution Blue bars denote a histogram of data divided into 1 sec bins. Red curve is a Poisson curve with rate = median count rate of data. |
 |
 |
| Quadrant-wise count rates Data is divided into 100 sec bins |
 |
|
| Module-wise count rates for Quadrant A Data is divided into 100 sec bins |
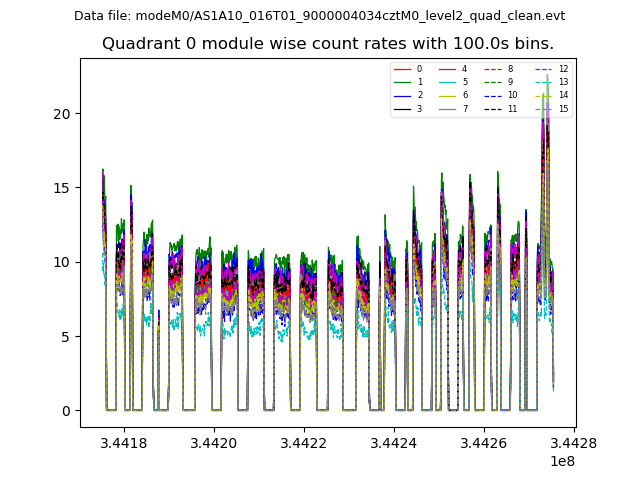 |
 |
| Module-wise count rates for Quadrant B Data is divided into 100 sec bins |
 |
 |
| Module-wise count rates for Quadrant C Data is divided into 100 sec bins |
 |
 |
| Module-wise count rates for Quadrant D Data is divided into 100 sec bins |
 |
 |
| Parameter | Plot |
|---|---|
| CZT HV Monitor |  |
| D_VDD |  |
| Temperature 1 |  |
| Veto HV Monitor |  |
| Veto LLD |  |
| Alpha Counter |  |
| _CPM_Rate |  |
| CZT Counter |  |
| +2.5 Volts monitor |  |
| +5 Volts monitor |  |
| _ROLL_ROT |  |
| _Roll_DEC |  |
| _Roll_RA |  |
| Veto Counter |  |