| Param | Original file | Final file |
|---|---|---|
| Filename | modeM0/AS1A10_049T01_9000004032cztM0_level2_bc.evt | modeM0/AS1A10_049T01_9000004032cztM0_level2_quad_clean.evt |
| Size (bytes) | 3,983,218,560 | 1,370,741,760 |
| Size | 3.7 GB | 1.3 GB |
| Events in quadrant A | 20,851,631 | 9,163,648 |
| Events in quadrant B | 26,002,313 | 9,123,107 |
| Events in quadrant C | 22,070,244 | 8,646,053 |
| Events in quadrant D | 45,550,770 | 8,380,543 |
| Mode M9 | |||
|---|---|---|---|
| Quadrant | BADHDUFLAG | Total packets | Discarded packets |
| A | 0 | 158 | 0 |
| B | 0 | 158 | 0 |
| C | 0 | 158 | 0 |
| D | 0 | 158 | 0 |
| Mode SS | |||
|---|---|---|---|
| Quadrant | BADHDUFLAG | Total packets | Discarded packets |
| A | 0 | 1840 | 0 |
| B | 0 | 1840 | 0 |
| C | 0 | 1840 | 0 |
| D | 0 | 1840 | 0 |
| Mode M0 | |||
|---|---|---|---|
| Quadrant | BADHDUFLAG | Total packets | Discarded packets |
| A | 0 | 192947 | 0 |
| B | 0 | 212031 | 0 |
| C | 0 | 200320 | 0 |
| D | 0 | 277731 | 0 |
| Quadrant | Total seconds | Saturated seconds | Saturation percentage |
|---|---|---|---|
| A | 90573 | 1073 | 1.184680% |
| B | 90573 | 2192 | 2.420147% |
| C | 90573 | 2109 | 2.328508% |
| D | 90573 | 4166 | 4.599605% |
Noise dominated data is calculated using 1-second bins in cleaned event files. If a bin has >2000 counts, and if more than 50% of those come from <1% of pixels, then it is considered to be noise-dominated and hence unusable.
| Quadrant | # 1 sec bins | Bins with >0 counts | Bins with >2000 counts | High rate bins dominated by noise | Noise dominated (total time) | Noise dominated (detector-on time) | Marked lightcurve |
|---|---|---|---|---|---|---|---|
| A | 105993 | 90564 | 4 | 4 | 0.00% | 0.00% |  |
| B | 105993 | 90563 | 39 | 39 | 0.04% | 0.04% | 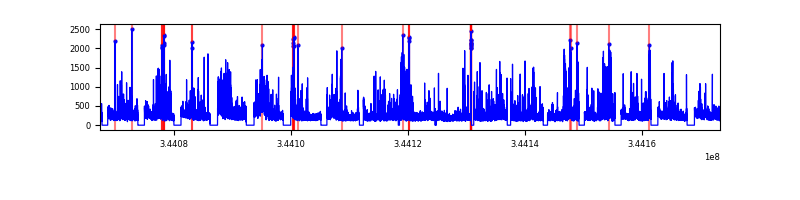 |
| C | 105993 | 90559 | 58 | 58 | 0.05% | 0.06% |  |
| D | 105993 | 90562 | 875 | 875 | 0.83% | 0.97% |  |
Top three noisy pixels from each quadrant. If the there are fewer than three noisy pixels in the level2.evt file, extra rows are filled as -1
| Pixel properties | Quadrant properties | ||||||
|---|---|---|---|---|---|---|---|
| Quadrant | DetID | PixID | Counts | Sigma | Mean | Median | Sigma |
| A | 15 | 174 | 607644 | 543.34 | 5216 | 5143 | 1108.9 |
| A | 13 | 254 | 146316 | 127.31 | 5216 | 5143 | 1108.9 |
| A | 8 | 192 | 75111 | 63.1 | 5216 | 5143 | 1108.9 |
| B | 10 | 245 | 4782859 | 4966.35 | 5205 | 5103 | 962.0 |
| B | 0 | 230 | 569719 | 586.9 | 5205 | 5103 | 962.0 |
| B | 15 | 32 | 161334 | 162.4 | 5205 | 5103 | 962.0 |
| C | 2 | 16 | 1805211 | 1563.19 | 4929 | 4936 | 1151.7 |
| C | 3 | 233 | 1181813 | 1021.89 | 4929 | 4936 | 1151.7 |
| C | 6 | 112 | 99005 | 81.68 | 4929 | 4936 | 1151.7 |
| D | 1 | 52 | 9911890 | 8638.96 | 5000 | 4861 | 1146.8 |
| D | 8 | 195 | 9336372 | 8137.11 | 5000 | 4861 | 1146.8 |
| D | 2 | 250 | 1957998 | 1703.14 | 5000 | 4861 | 1146.8 |
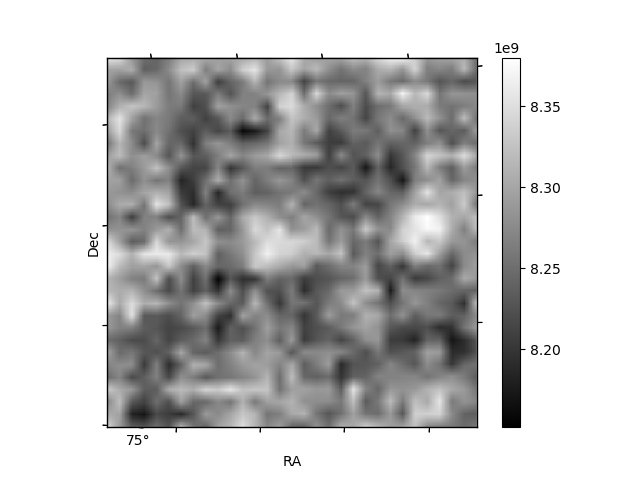
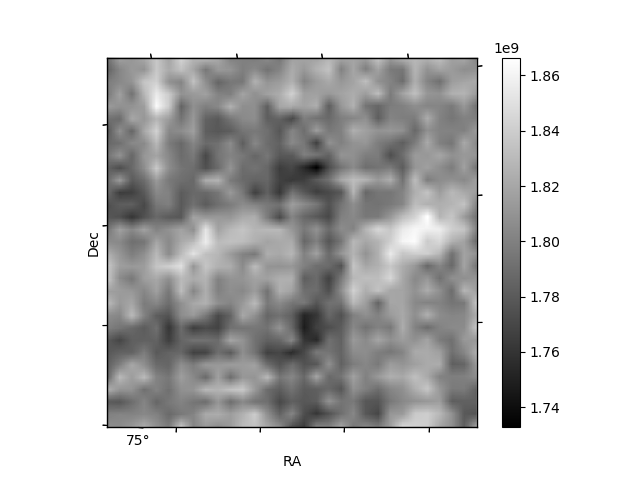
Histogram calculated using DETX and DETY for each event in the final _common_clean file
| Quadrant A |  |
 |
Quadrant B |
|---|---|---|---|
| Quadrant D |  |
 |
Quadrant C |
| Plot type | Count rate plots | Images |
|---|---|---|
| Comparison with Poisson distribution Blue bars denote a histogram of data divided into 1 sec bins. Red curve is a Poisson curve with rate = median count rate of data. |
 |
 |
| Quadrant-wise count rates Data is divided into 100 sec bins |
 |
|
| Module-wise count rates for Quadrant A Data is divided into 100 sec bins |
 |
 |
| Module-wise count rates for Quadrant B Data is divided into 100 sec bins |
 |
 |
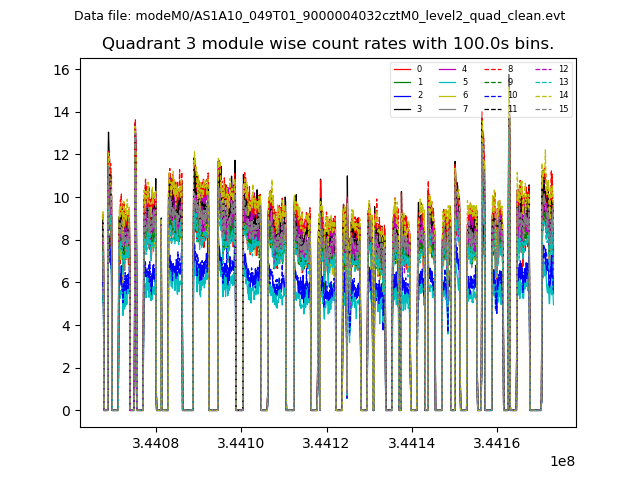
| Module-wise count rates for Quadrant C Data is divided into 100 sec bins |
 |
 |
| Module-wise count rates for Quadrant D Data is divided into 100 sec bins |
 |
 |
| Parameter | Plot |
|---|---|
| CZT HV Monitor | 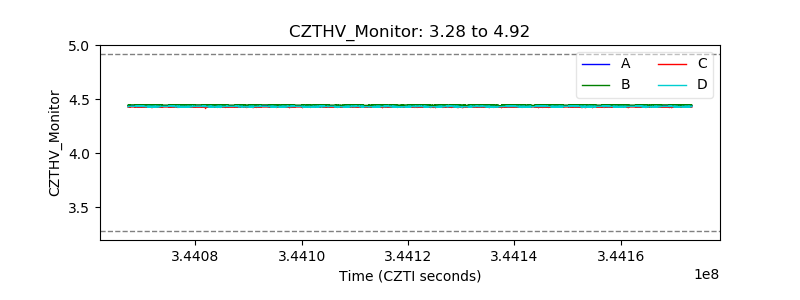 |
| D_VDD |  |
| Temperature 1 | 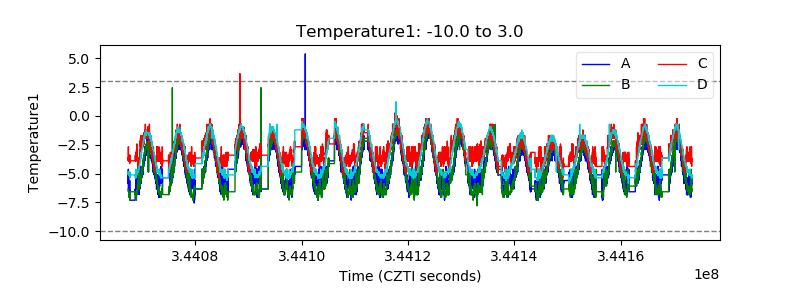 |
| Veto HV Monitor |  |
| Veto LLD |  |
| Alpha Counter | 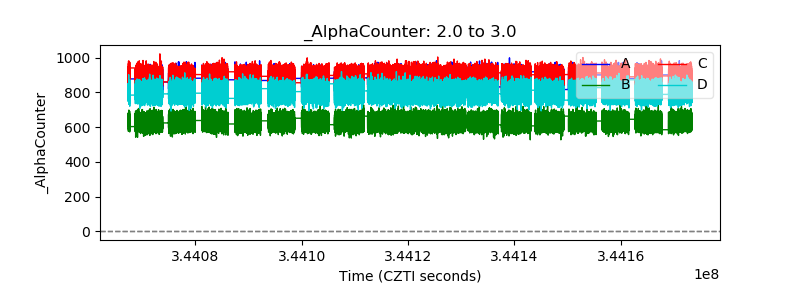 |
| _CPM_Rate |  |
| CZT Counter | 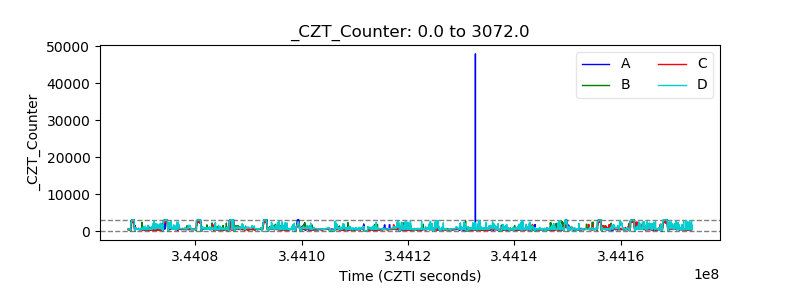 |
| +2.5 Volts monitor |  |
| +5 Volts monitor |  |
| _ROLL_ROT |  |
| _Roll_DEC |  |
| _Roll_RA |  |
| Veto Counter |  |