| Param | Original file | Final file |
|---|---|---|
| Filename | modeM0/AS1A10_048T06_9000004030cztM0_level2_bc.evt | modeM0/AS1A10_048T06_9000004030cztM0_level2_quad_clean.evt |
| Size (bytes) | 4,815,887,040 | 1,446,497,280 |
| Size | 4.5 GB | 1.3 GB |
| Events in quadrant A | 23,702,664 | 9,528,217 |
| Events in quadrant B | 28,019,630 | 9,575,866 |
| Events in quadrant C | 23,372,163 | 9,054,219 |
| Events in quadrant D | 63,393,814 | 8,237,656 |
| Mode M0 | |||
|---|---|---|---|
| Quadrant | BADHDUFLAG | Total packets | Discarded packets |
| A | 0 | 227989 | 0 |
| B | 0 | 243139 | 0 |
| C | 0 | 229734 | 0 |
| D | 0 | 378571 | 0 |
| Mode SS | |||
|---|---|---|---|
| Quadrant | BADHDUFLAG | Total packets | Discarded packets |
| A | 0 | 2196 | 0 |
| B | 0 | 2196 | 0 |
| C | 0 | 2196 | 0 |
| D | 0 | 2196 | 0 |
| Mode M9 | |||
|---|---|---|---|
| Quadrant | BADHDUFLAG | Total packets | Discarded packets |
| A | 0 | 144 | 0 |
| B | 0 | 144 | 0 |
| C | 0 | 144 | 0 |
| D | 0 | 144 | 0 |
| Quadrant | Total seconds | Saturated seconds | Saturation percentage |
|---|---|---|---|
| A | 108223 | 1139 | 1.052457% |
| B | 108223 | 1689 | 1.560666% |
| C | 108223 | 1950 | 1.801835% |
| D | 108223 | 12802 | 11.829278% |
Noise dominated data is calculated using 1-second bins in cleaned event files. If a bin has >2000 counts, and if more than 50% of those come from <1% of pixels, then it is considered to be noise-dominated and hence unusable.
| Quadrant | # 1 sec bins | Bins with >0 counts | Bins with >2000 counts | High rate bins dominated by noise | Noise dominated (total time) | Noise dominated (detector-on time) | Marked lightcurve |
|---|---|---|---|---|---|---|---|
| A | 122269 | 108215 | 135 | 135 | 0.11% | 0.12% | 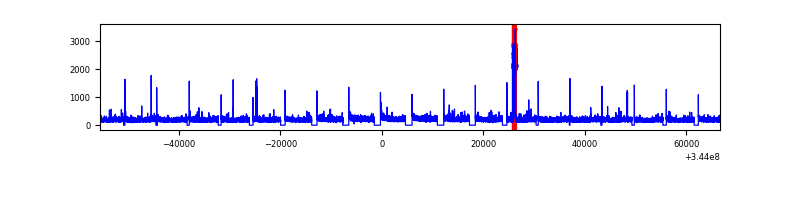 |
| B | 122269 | 108211 | 21 | 21 | 0.02% | 0.02% |  |
| C | 122269 | 108212 | 8 | 8 | 0.01% | 0.01% |  |
| D | 122268 | 108152 | 2868 | 2868 | 2.35% | 2.65% | 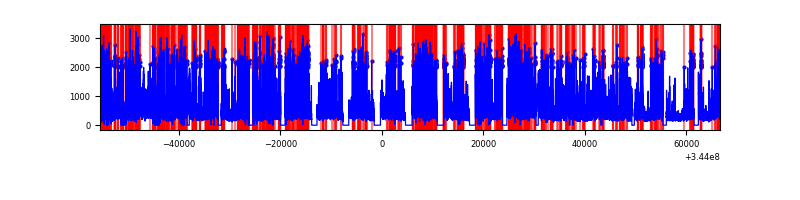 |
Top three noisy pixels from each quadrant. If the there are fewer than three noisy pixels in the level2.evt file, extra rows are filled as -1
| Pixel properties | Quadrant properties | ||||||
|---|---|---|---|---|---|---|---|
| Quadrant | DetID | PixID | Counts | Sigma | Mean | Median | Sigma |
| A | 6 | 16 | 866815 | 679.56 | 5872 | 5771 | 1267.1 |
| A | 13 | 254 | 169874 | 129.51 | 5872 | 5771 | 1267.1 |
| A | 8 | 192 | 86886 | 64.02 | 5872 | 5771 | 1267.1 |
| B | 10 | 245 | 3010331 | 2695.3 | 5901 | 5760 | 1114.7 |
| B | 0 | 230 | 793956 | 707.06 | 5901 | 5760 | 1114.7 |
| B | 15 | 32 | 623536 | 554.19 | 5901 | 5760 | 1114.7 |
| C | 3 | 233 | 1265453 | 971.17 | 5545 | 5523 | 1297.3 |
| C | 15 | 208 | 281546 | 212.76 | 5545 | 5523 | 1297.3 |
| C | 2 | 16 | 236054 | 177.7 | 5545 | 5523 | 1297.3 |
| D | 1 | 52 | 25680427 | 20593.33 | 5365 | 5182 | 1246.8 |
| D | 8 | 195 | 12433312 | 9968.22 | 5365 | 5182 | 1246.8 |
| D | 2 | 250 | 1694979 | 1355.33 | 5365 | 5182 | 1246.8 |
Histogram calculated using DETX and DETY for each event in the final _common_clean file
| Quadrant A | 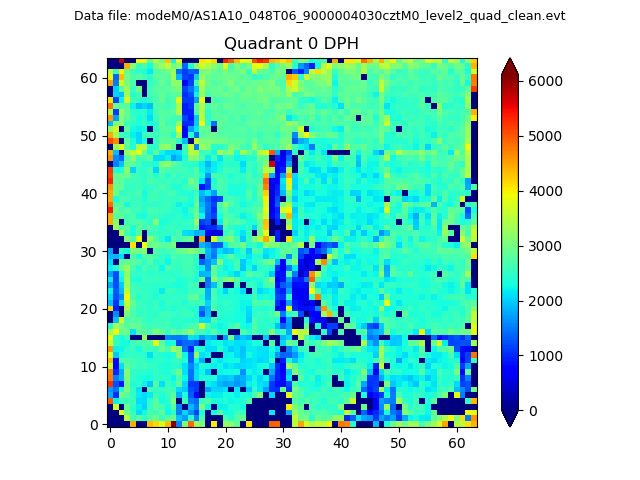 |
 |
Quadrant B |
|---|---|---|---|
| Quadrant D |  |
 |
Quadrant C |
| Plot type | Count rate plots | Images |
|---|---|---|
| Comparison with Poisson distribution Blue bars denote a histogram of data divided into 1 sec bins. Red curve is a Poisson curve with rate = median count rate of data. |
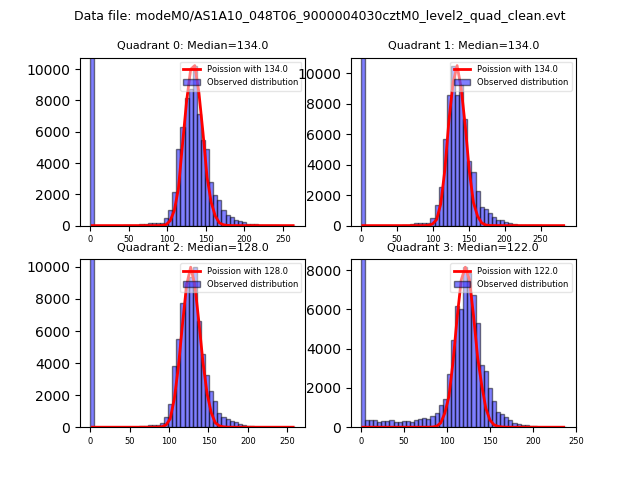 |
 |
| Quadrant-wise count rates Data is divided into 100 sec bins |
 |
|
| Module-wise count rates for Quadrant A Data is divided into 100 sec bins |
 |
 |
| Module-wise count rates for Quadrant B Data is divided into 100 sec bins |
 |
 |
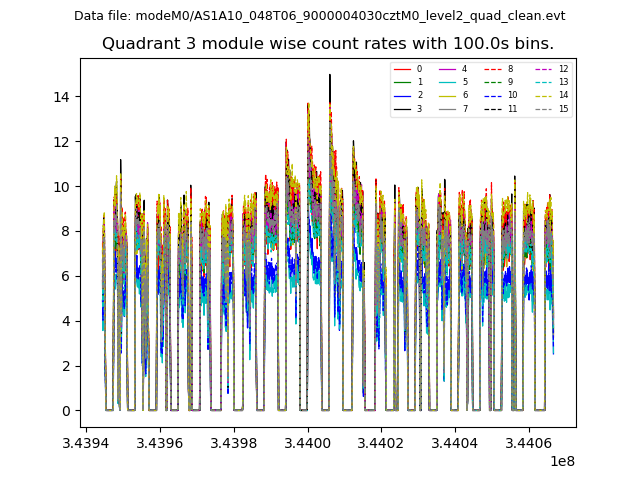
| Module-wise count rates for Quadrant C Data is divided into 100 sec bins |
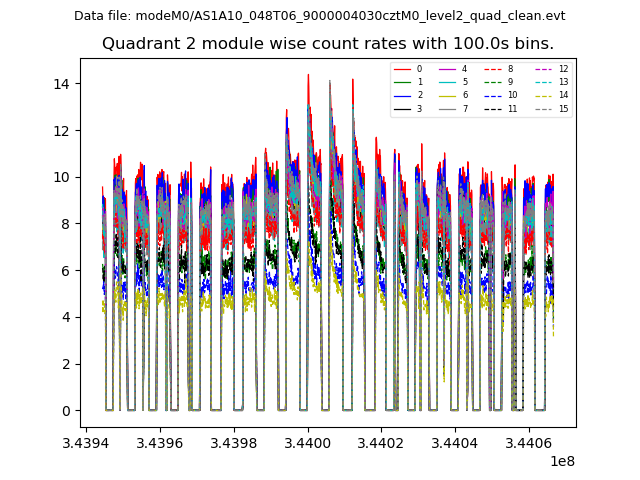 |
 |
| Module-wise count rates for Quadrant D Data is divided into 100 sec bins |
 |
 |
| Parameter | Plot |
|---|---|
| CZT HV Monitor |  |
| D_VDD |  |
| Temperature 1 |  |
| Veto HV Monitor | 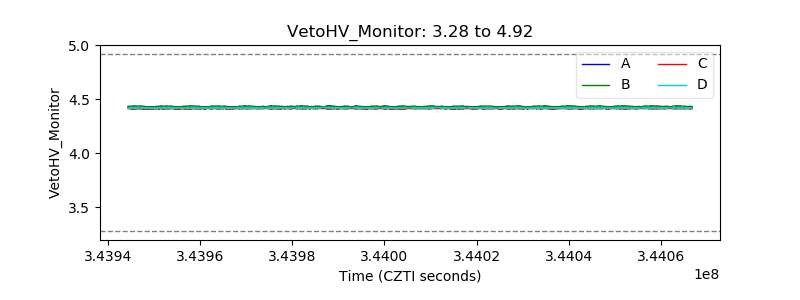 |
| Veto LLD |  |
| Alpha Counter | 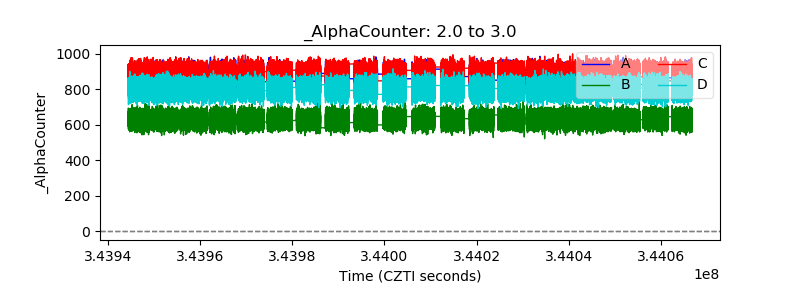 |
| _CPM_Rate |  |
| CZT Counter |  |
| +2.5 Volts monitor |  |
| +5 Volts monitor |  |
| _ROLL_ROT | 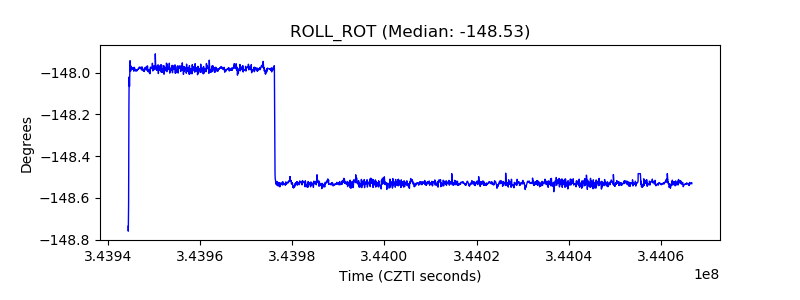 |
| _Roll_DEC |  |
| _Roll_RA |  |
| Veto Counter |  |