| Param | Original file | Final file |
|---|---|---|
| Filename | modeM0/AS1A10_048T01_9000004028cztM0_level2_bc.evt | modeM0/AS1A10_048T01_9000004028cztM0_level2_quad_clean.evt |
| Size (bytes) | 2,570,875,200 | 915,851,520 |
| Size | 2.4 GB | 873.4 MB |
| Events in quadrant A | 15,480,479 | 6,042,311 |
| Events in quadrant B | 15,242,769 | 6,065,653 |
| Events in quadrant C | 15,014,797 | 5,675,611 |
| Events in quadrant D | 27,498,334 | 5,305,570 |
| Mode M0 | |||
|---|---|---|---|
| Quadrant | BADHDUFLAG | Total packets | Discarded packets |
| A | 0 | 144667 | 0 |
| B | 0 | 144837 | 0 |
| C | 0 | 144715 | 0 |
| D | 0 | 207006 | 0 |
| Mode M9 | |||
|---|---|---|---|
| Quadrant | BADHDUFLAG | Total packets | Discarded packets |
| A | 0 | 94 | 0 |
| B | 0 | 94 | 0 |
| C | 0 | 94 | 0 |
| D | 0 | 94 | 0 |
| Mode SS | |||
|---|---|---|---|
| Quadrant | BADHDUFLAG | Total packets | Discarded packets |
| A | 0 | 1378 | 0 |
| B | 0 | 1378 | 0 |
| C | 0 | 1378 | 0 |
| D | 0 | 1378 | 0 |
| Quadrant | Total seconds | Saturated seconds | Saturation percentage |
|---|---|---|---|
| A | 67818 | 662 | 0.976142% |
| B | 67818 | 837 | 1.234186% |
| C | 67818 | 1075 | 1.585125% |
| D | 67818 | 6679 | 9.848418% |
Noise dominated data is calculated using 1-second bins in cleaned event files. If a bin has >2000 counts, and if more than 50% of those come from <1% of pixels, then it is considered to be noise-dominated and hence unusable.
| Quadrant | # 1 sec bins | Bins with >0 counts | Bins with >2000 counts | High rate bins dominated by noise | Noise dominated (total time) | Noise dominated (detector-on time) | Marked lightcurve |
|---|---|---|---|---|---|---|---|
| A | 86777 | 67813 | 5 | 5 | 0.01% | 0.01% |  |
| B | 86777 | 67811 | 5 | 5 | 0.01% | 0.01% |  |
| C | 86777 | 67813 | 7 | 7 | 0.01% | 0.01% |  |
| D | 86777 | 67806 | 505 | 505 | 0.58% | 0.74% | 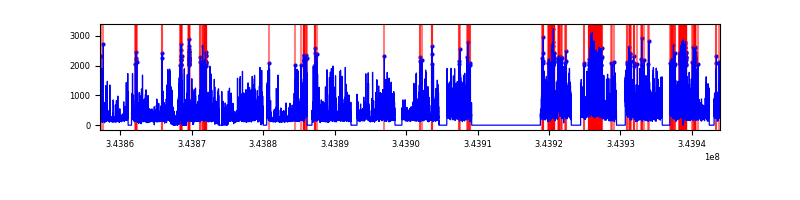 |
Top three noisy pixels from each quadrant. If the there are fewer than three noisy pixels in the level2.evt file, extra rows are filled as -1
| Pixel properties | Quadrant properties | ||||||
|---|---|---|---|---|---|---|---|
| Quadrant | DetID | PixID | Counts | Sigma | Mean | Median | Sigma |
| A | 6 | 16 | 989206 | 1215.78 | 3717 | 3657 | 810.6 |
| A | 13 | 254 | 107117 | 127.63 | 3717 | 3657 | 810.6 |
| A | 4 | 2 | 56131 | 64.73 | 3717 | 3657 | 810.6 |
| B | 0 | 230 | 467093 | 657.66 | 3732 | 3643 | 704.7 |
| B | 10 | 245 | 233501 | 326.18 | 3732 | 3643 | 704.7 |
| B | 0 | 190 | 82475 | 111.87 | 3732 | 3643 | 704.7 |
| C | 3 | 233 | 1061636 | 1287.73 | 3499 | 3488 | 821.7 |
| C | 2 | 16 | 364415 | 439.24 | 3499 | 3488 | 821.7 |
| C | 6 | 112 | 71124 | 82.31 | 3499 | 3488 | 821.7 |
| D | 1 | 52 | 7665847 | 9554.87 | 3447 | 3334 | 801.9 |
| D | 13 | 104 | 2631245 | 3276.91 | 3447 | 3334 | 801.9 |
| D | 7 | 238 | 1898295 | 2362.95 | 3447 | 3334 | 801.9 |
Histogram calculated using DETX and DETY for each event in the final _common_clean file
| Quadrant A |  |
 |
Quadrant B |
|---|---|---|---|
| Quadrant D |  |
 |
Quadrant C |
| Plot type | Count rate plots | Images |
|---|---|---|
| Comparison with Poisson distribution Blue bars denote a histogram of data divided into 1 sec bins. Red curve is a Poisson curve with rate = median count rate of data. |
 |
 |
| Quadrant-wise count rates Data is divided into 100 sec bins |
 |
|
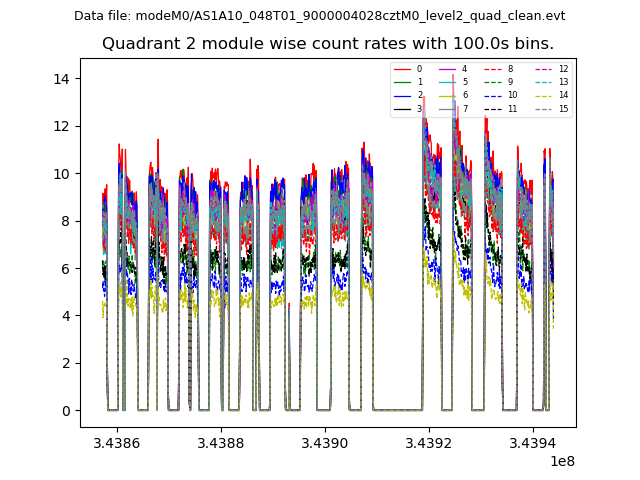
| Module-wise count rates for Quadrant A Data is divided into 100 sec bins |
 |
 |
| Module-wise count rates for Quadrant B Data is divided into 100 sec bins |
 |
 |
| Module-wise count rates for Quadrant C Data is divided into 100 sec bins |
 |
 |
| Module-wise count rates for Quadrant D Data is divided into 100 sec bins |
 |
 |
| Parameter | Plot |
|---|---|
| CZT HV Monitor |  |
| D_VDD | 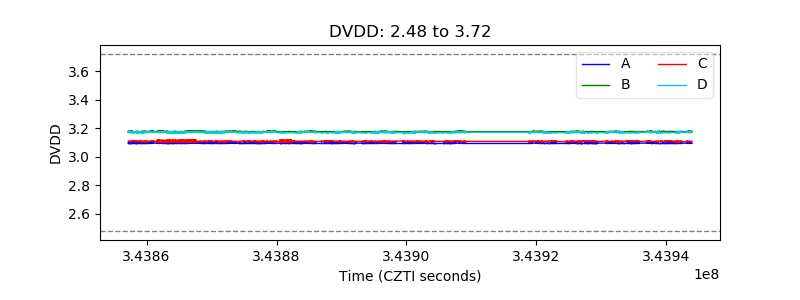 |
| Temperature 1 |  |
| Veto HV Monitor |  |
| Veto LLD |  |
| Alpha Counter |  |
| _CPM_Rate |  |
| CZT Counter |  |
| +2.5 Volts monitor | 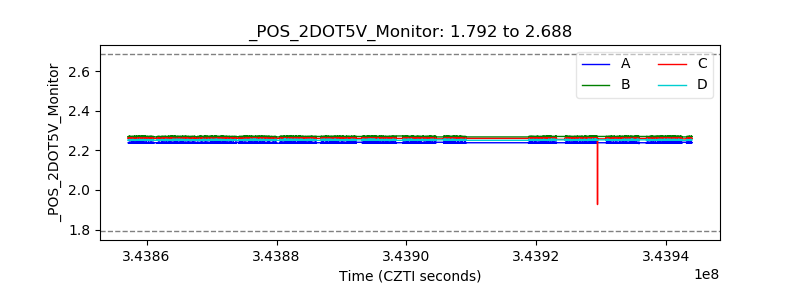 |
| +5 Volts monitor |  |
| _ROLL_ROT |  |
| _Roll_DEC | 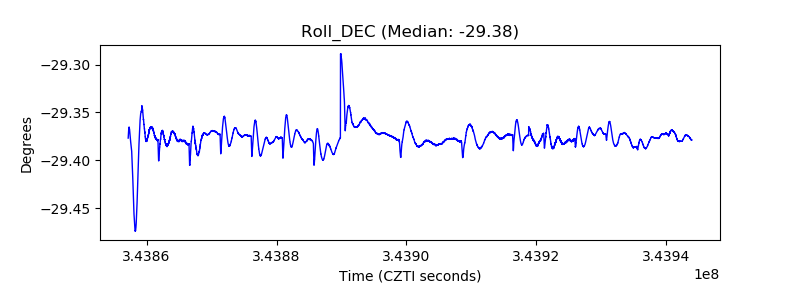 |
| _Roll_RA |  |
| Veto Counter |  |