| Param | Original file | Final file |
|---|---|---|
| Filename | modeM0/AS1A10_024T01_9000004026cztM0_level2_bc.evt | modeM0/AS1A10_024T01_9000004026cztM0_level2_quad_clean.evt |
| Size (bytes) | 923,109,120 | 329,397,120 |
| Size | 880.3 MB | 314.1 MB |
| Events in quadrant A | 5,518,973 | 2,214,104 |
| Events in quadrant B | 6,482,908 | 2,176,386 |
| Events in quadrant C | 5,406,925 | 2,058,829 |
| Events in quadrant D | 9,021,676 | 1,991,513 |
| Mode M0 | |||
|---|---|---|---|
| Quadrant | BADHDUFLAG | Total packets | Discarded packets |
| A | 0 | 49012 | 0 |
| B | 0 | 53699 | 0 |
| C | 0 | 49323 | 0 |
| D | 0 | 61256 | 0 |
| Mode M9 | |||
|---|---|---|---|
| Quadrant | BADHDUFLAG | Total packets | Discarded packets |
| A | 0 | 59 | 0 |
| B | 0 | 59 | 0 |
| C | 0 | 59 | 0 |
| D | 0 | 59 | 0 |
| Mode SS | |||
|---|---|---|---|
| Quadrant | BADHDUFLAG | Total packets | Discarded packets |
| A | 0 | 456 | 0 |
| B | 0 | 456 | 0 |
| C | 0 | 456 | 0 |
| D | 0 | 456 | 0 |
| Quadrant | Total seconds | Saturated seconds | Saturation percentage |
|---|---|---|---|
| A | 22323 | 332 | 1.487255% |
| B | 22323 | 729 | 3.265690% |
| C | 22323 | 455 | 2.038257% |
| D | 22323 | 1403 | 6.284998% |
Noise dominated data is calculated using 1-second bins in cleaned event files. If a bin has >2000 counts, and if more than 50% of those come from <1% of pixels, then it is considered to be noise-dominated and hence unusable.
| Quadrant | # 1 sec bins | Bins with >0 counts | Bins with >2000 counts | High rate bins dominated by noise | Noise dominated (total time) | Noise dominated (detector-on time) | Marked lightcurve |
|---|---|---|---|---|---|---|---|
| A | 28218 | 22322 | 5 | 5 | 0.02% | 0.02% |  |
| B | 28218 | 22321 | 6 | 6 | 0.02% | 0.03% |  |
| C | 28218 | 22320 | 1 | 1 | 0.00% | 0.00% |  |
| D | 28218 | 22320 | 406 | 406 | 1.44% | 1.82% |  |
Top three noisy pixels from each quadrant. If the there are fewer than three noisy pixels in the level2.evt file, extra rows are filled as -1
| Pixel properties | Quadrant properties | ||||||
|---|---|---|---|---|---|---|---|
| Quadrant | DetID | PixID | Counts | Sigma | Mean | Median | Sigma |
| A | 6 | 16 | 195891 | 677.52 | 1329 | 1311 | 287.2 |
| A | 15 | 174 | 80045 | 274.15 | 1329 | 1311 | 287.2 |
| A | 0 | 13 | 70677 | 241.53 | 1329 | 1311 | 287.2 |
| B | 5 | 172 | 475110 | 1921.45 | 1313 | 1287 | 246.6 |
| B | 10 | 245 | 303353 | 1224.94 | 1313 | 1287 | 246.6 |
| B | 0 | 190 | 190334 | 766.62 | 1313 | 1287 | 246.6 |
| C | 3 | 233 | 612837 | 2136.16 | 1226 | 1225 | 286.3 |
| C | 15 | 208 | 52176 | 177.96 | 1226 | 1225 | 286.3 |
| C | 0 | 207 | 13192 | 41.8 | 1226 | 1225 | 286.3 |
| D | 1 | 52 | 3167871 | 11197.02 | 1240 | 1205 | 282.8 |
| D | 2 | 250 | 434407 | 1531.76 | 1240 | 1205 | 282.8 |
| D | 7 | 69 | 162848 | 571.55 | 1240 | 1205 | 282.8 |
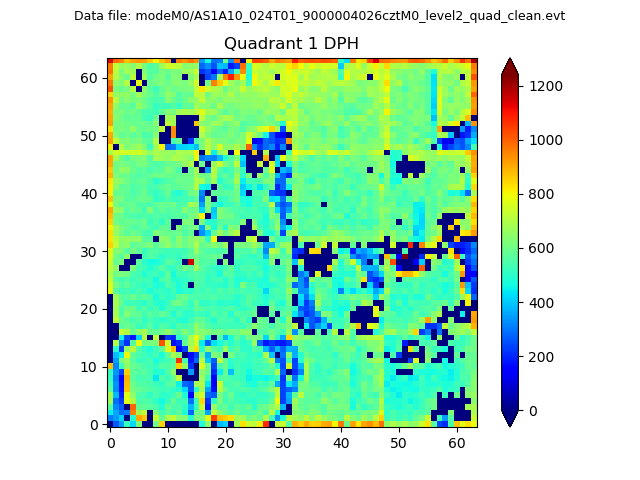
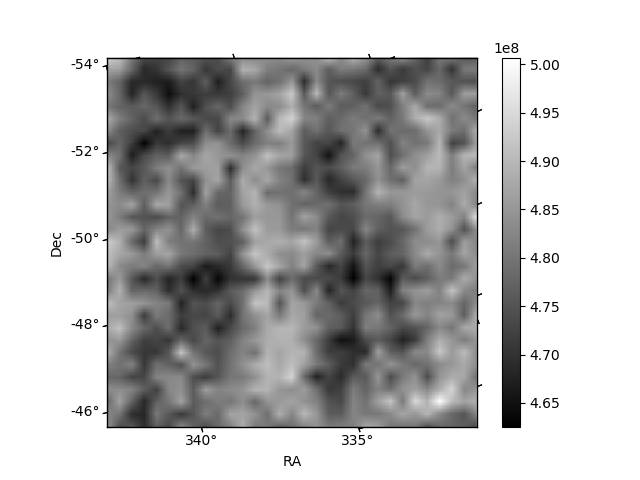
Histogram calculated using DETX and DETY for each event in the final _common_clean file
| Quadrant A |  |
 |
Quadrant B |
|---|---|---|---|
| Quadrant D |  |
 |
Quadrant C |
| Plot type | Count rate plots | Images |
|---|---|---|
| Comparison with Poisson distribution Blue bars denote a histogram of data divided into 1 sec bins. Red curve is a Poisson curve with rate = median count rate of data. |
 |
 |
| Quadrant-wise count rates Data is divided into 100 sec bins |
 |
|
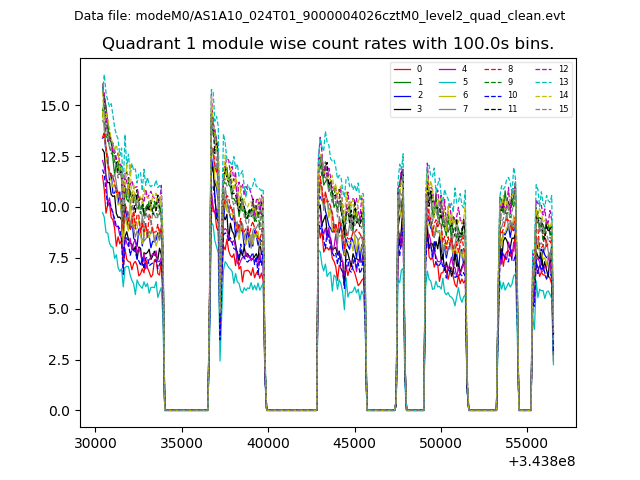
| Module-wise count rates for Quadrant A Data is divided into 100 sec bins |
 |
 |
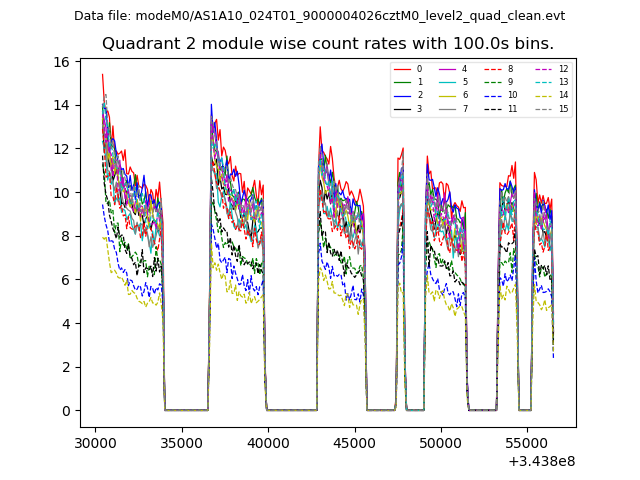
| Module-wise count rates for Quadrant B Data is divided into 100 sec bins |
 |
 |
| Module-wise count rates for Quadrant C Data is divided into 100 sec bins |
 |
 |
| Module-wise count rates for Quadrant D Data is divided into 100 sec bins |
 |
 |
| Parameter | Plot |
|---|---|
| CZT HV Monitor |  |
| D_VDD |  |
| Temperature 1 |  |
| Veto HV Monitor |  |
| Veto LLD |  |
| Alpha Counter |  |
| _CPM_Rate |  |
| CZT Counter |  |
| +2.5 Volts monitor |  |
| +5 Volts monitor |  |
| _ROLL_ROT |  |
| _Roll_DEC | 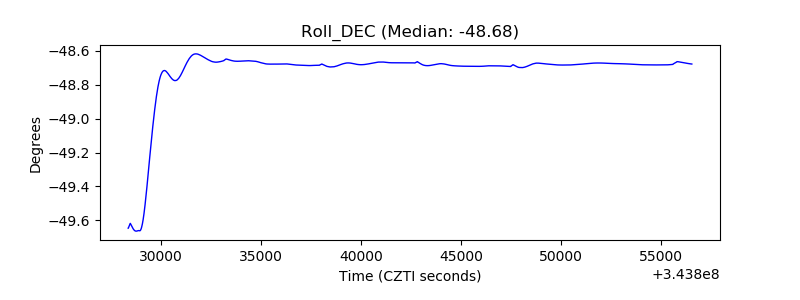 |
| _Roll_RA |  |
| Veto Counter |  |