| Param | Original file | Final file |
|---|---|---|
| Filename | modeM0/AS1A10_002T04_9000004022cztM0_level2_bc.evt | modeM0/AS1A10_002T04_9000004022cztM0_level2_quad_clean.evt |
| Size (bytes) | 3,971,715,840 | 1,441,546,560 |
| Size | 3.7 GB | 1.3 GB |
| Events in quadrant A | 22,266,713 | 9,649,066 |
| Events in quadrant B | 24,771,530 | 9,401,136 |
| Events in quadrant C | 23,253,885 | 9,061,141 |
| Events in quadrant D | 43,245,893 | 8,761,949 |
| Mode SS | |||
|---|---|---|---|
| Quadrant | BADHDUFLAG | Total packets | Discarded packets |
| A | 0 | 2020 | 0 |
| B | 0 | 2020 | 0 |
| C | 0 | 2020 | 0 |
| D | 0 | 2020 | 0 |
| Mode M9 | |||
|---|---|---|---|
| Quadrant | BADHDUFLAG | Total packets | Discarded packets |
| A | 0 | 181 | 0 |
| B | 0 | 181 | 0 |
| C | 0 | 181 | 0 |
| D | 0 | 181 | 0 |
| Mode M0 | |||
|---|---|---|---|
| Quadrant | BADHDUFLAG | Total packets | Discarded packets |
| A | 0 | 209316 | 0 |
| B | 0 | 221219 | 0 |
| C | 0 | 217294 | 0 |
| D | 0 | 288098 | 0 |
| Quadrant | Total seconds | Saturated seconds | Saturation percentage |
|---|---|---|---|
| A | 99091 | 1129 | 1.139357% |
| B | 99091 | 2242 | 2.262567% |
| C | 99091 | 1979 | 1.997154% |
| D | 99091 | 6549 | 6.609077% |
Noise dominated data is calculated using 1-second bins in cleaned event files. If a bin has >2000 counts, and if more than 50% of those come from <1% of pixels, then it is considered to be noise-dominated and hence unusable.
| Quadrant | # 1 sec bins | Bins with >0 counts | Bins with >2000 counts | High rate bins dominated by noise | Noise dominated (total time) | Noise dominated (detector-on time) | Marked lightcurve |
|---|---|---|---|---|---|---|---|
| A | 117241 | 99077 | 19 | 19 | 0.02% | 0.02% |  |
| B | 117241 | 99073 | 27 | 27 | 0.02% | 0.03% | 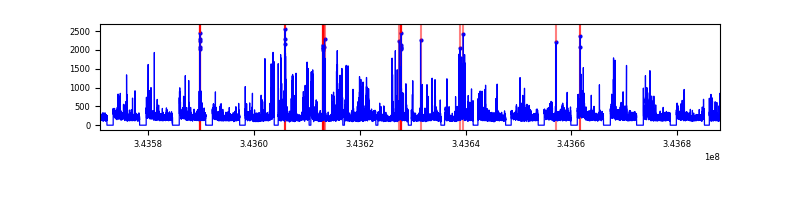 |
| C | 117241 | 99073 | 0 | 0 | 0.00% | 0.00% | 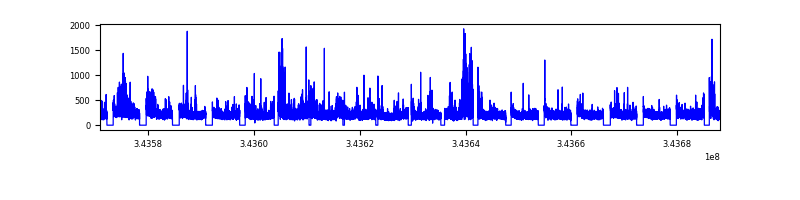 |
| D | 117241 | 99075 | 1312 | 1312 | 1.12% | 1.32% |  |
Top three noisy pixels from each quadrant. If the there are fewer than three noisy pixels in the level2.evt file, extra rows are filled as -1
| Pixel properties | Quadrant properties | ||||||
|---|---|---|---|---|---|---|---|
| Quadrant | DetID | PixID | Counts | Sigma | Mean | Median | Sigma |
| A | 6 | 16 | 227200 | 180.42 | 5680 | 5594 | 1228.3 |
| A | 13 | 254 | 171957 | 135.44 | 5680 | 5594 | 1228.3 |
| A | 13 | 248 | 76147 | 57.44 | 5680 | 5594 | 1228.3 |
| B | 10 | 245 | 2009549 | 1931.26 | 5558 | 5432 | 1037.7 |
| B | 0 | 190 | 553405 | 528.05 | 5558 | 5432 | 1037.7 |
| B | 15 | 32 | 261554 | 246.81 | 5558 | 5432 | 1037.7 |
| C | 3 | 233 | 2611624 | 2044.39 | 5350 | 5318 | 1274.9 |
| C | 13 | 61 | 30479 | 19.74 | 5350 | 5318 | 1274.9 |
| C | 1 | 16 | 24239 | 14.84 | 5350 | 5318 | 1274.9 |
| D | 1 | 52 | 18711725 | 15076.31 | 5394 | 5243 | 1240.8 |
| D | 2 | 250 | 1694962 | 1361.81 | 5394 | 5243 | 1240.8 |
| D | 13 | 104 | 1311368 | 1052.66 | 5394 | 5243 | 1240.8 |
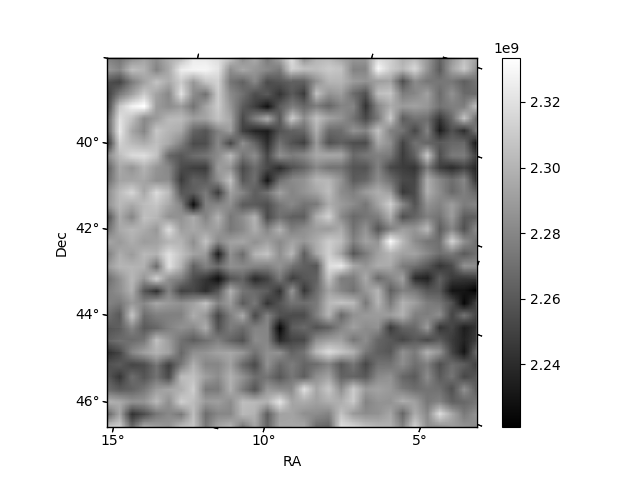
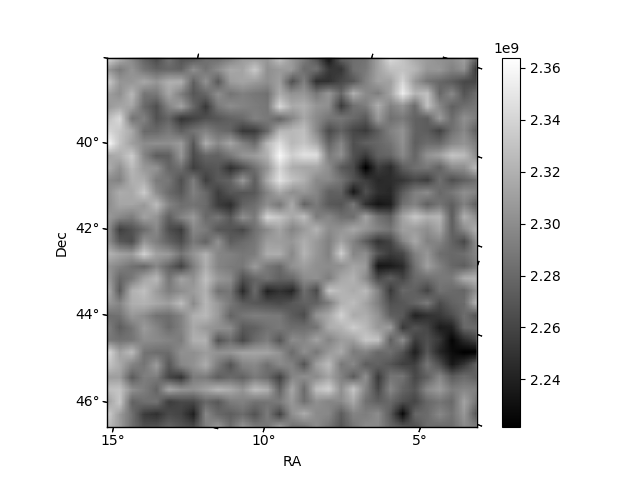
Histogram calculated using DETX and DETY for each event in the final _common_clean file
| Quadrant A |  |
 |
Quadrant B |
|---|---|---|---|
| Quadrant D |  |
 |
Quadrant C |
| Plot type | Count rate plots | Images |
|---|---|---|
| Comparison with Poisson distribution Blue bars denote a histogram of data divided into 1 sec bins. Red curve is a Poisson curve with rate = median count rate of data. |
 |
 |
| Quadrant-wise count rates Data is divided into 100 sec bins |
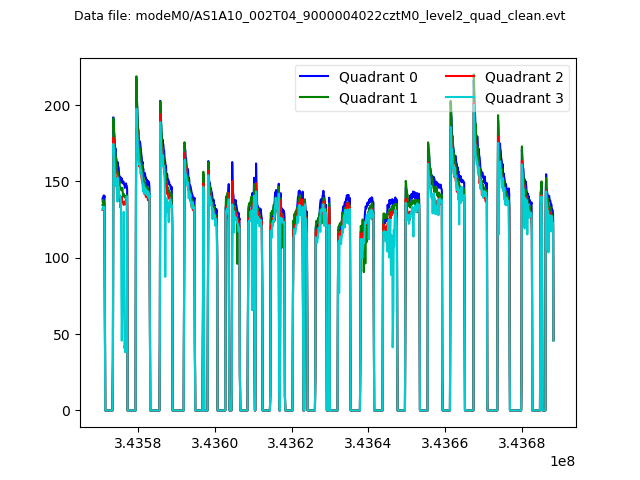 |
|
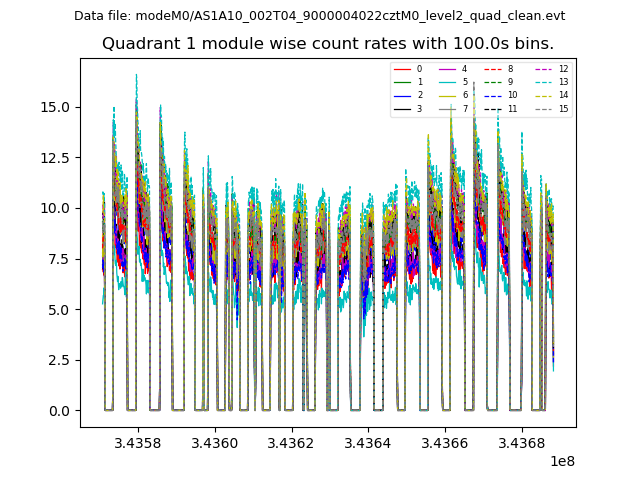
| Module-wise count rates for Quadrant A Data is divided into 100 sec bins |
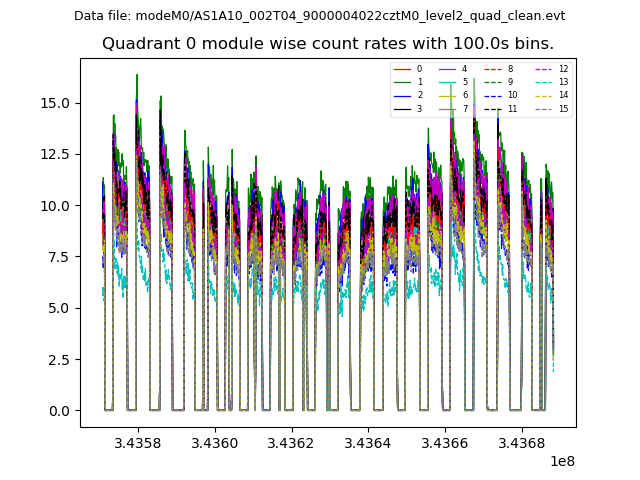 |
 |
| Module-wise count rates for Quadrant B Data is divided into 100 sec bins |
 |
 |
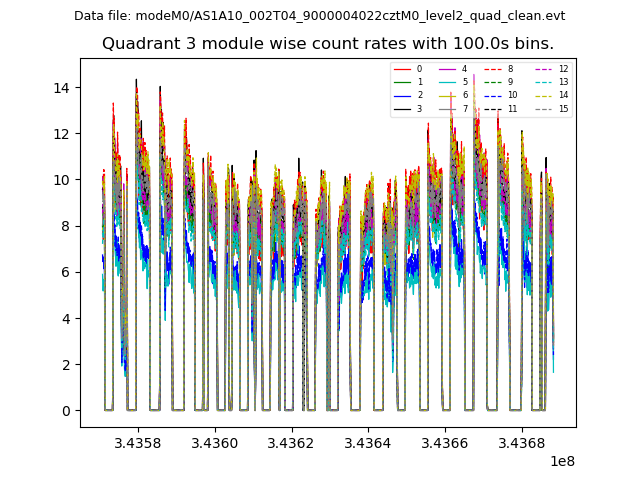
| Module-wise count rates for Quadrant C Data is divided into 100 sec bins |
 |
 |
| Module-wise count rates for Quadrant D Data is divided into 100 sec bins |
 |
 |
| Parameter | Plot |
|---|---|
| CZT HV Monitor |  |
| D_VDD | 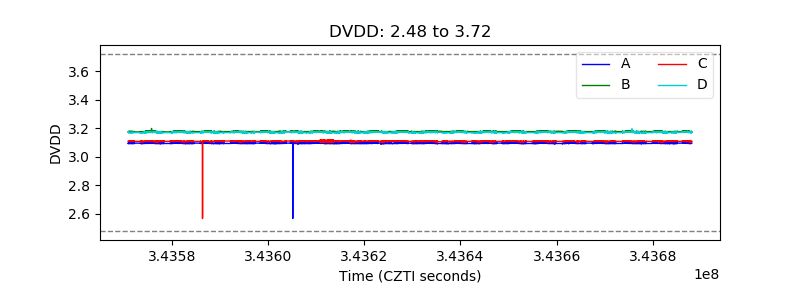 |
| Temperature 1 |  |
| Veto HV Monitor |  |
| Veto LLD |  |
| Alpha Counter |  |
| _CPM_Rate |  |
| CZT Counter | 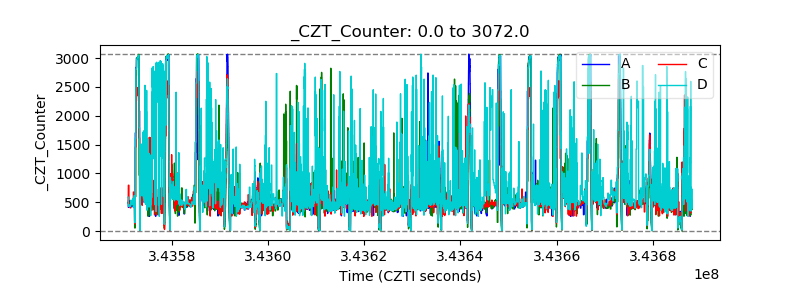 |
| +2.5 Volts monitor | 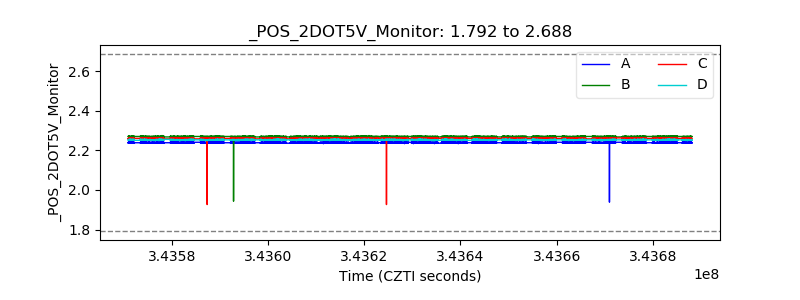 |
| +5 Volts monitor |  |
| _ROLL_ROT | 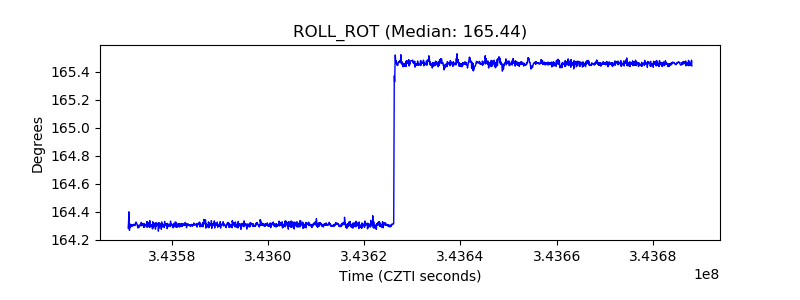 |
| _Roll_DEC |  |
| _Roll_RA |  |
| Veto Counter | 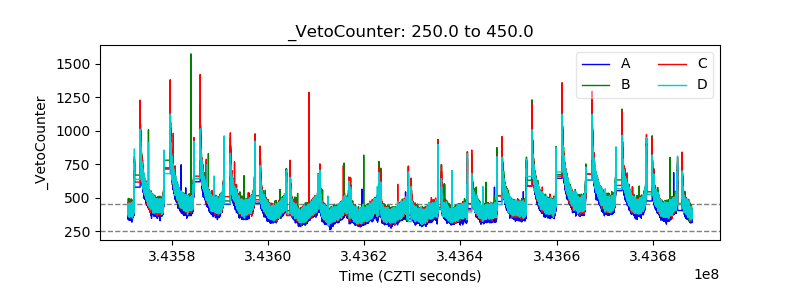 |