| Param | Original file | Final file |
|---|---|---|
| Filename | modeM0/AS1A10_048T08_9000004020cztM0_level2_bc.evt | modeM0/AS1A10_048T08_9000004020cztM0_level2_quad_clean.evt |
| Size (bytes) | 4,020,344,640 | 1,418,823,360 |
| Size | 3.7 GB | 1.3 GB |
| Events in quadrant A | 22,454,143 | 9,199,016 |
| Events in quadrant B | 28,324,602 | 9,213,793 |
| Events in quadrant C | 25,651,200 | 8,786,672 |
| Events in quadrant D | 38,089,752 | 8,492,711 |
| Mode M0 | |||
|---|---|---|---|
| Quadrant | BADHDUFLAG | Total packets | Discarded packets |
| A | 0 | 221931 | 0 |
| B | 0 | 243790 | 0 |
| C | 0 | 237387 | 0 |
| D | 0 | 273044 | 0 |
| Mode SS | |||
|---|---|---|---|
| Quadrant | BADHDUFLAG | Total packets | Discarded packets |
| A | 0 | 2162 | 0 |
| B | 0 | 2162 | 0 |
| C | 0 | 2162 | 0 |
| D | 0 | 2162 | 0 |
| Mode M9 | |||
|---|---|---|---|
| Quadrant | BADHDUFLAG | Total packets | Discarded packets |
| A | 0 | 161 | 0 |
| B | 0 | 161 | 0 |
| C | 0 | 161 | 0 |
| D | 0 | 161 | 0 |
| Quadrant | Total seconds | Saturated seconds | Saturation percentage |
|---|---|---|---|
| A | 106297 | 1075 | 1.011317% |
| B | 106297 | 3085 | 2.902246% |
| C | 106297 | 2307 | 2.170334% |
| D | 106297 | 3726 | 3.505273% |
Noise dominated data is calculated using 1-second bins in cleaned event files. If a bin has >2000 counts, and if more than 50% of those come from <1% of pixels, then it is considered to be noise-dominated and hence unusable.
| Quadrant | # 1 sec bins | Bins with >0 counts | Bins with >2000 counts | High rate bins dominated by noise | Noise dominated (total time) | Noise dominated (detector-on time) | Marked lightcurve |
|---|---|---|---|---|---|---|---|
| A | 122187 | 106282 | 16 | 16 | 0.01% | 0.02% |  |
| B | 122187 | 106280 | 145 | 145 | 0.12% | 0.14% | 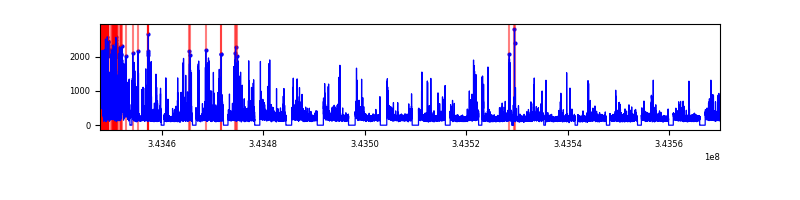 |
| C | 122187 | 106283 | 24 | 24 | 0.02% | 0.02% |  |
| D | 122187 | 106282 | 1081 | 1081 | 0.88% | 1.02% |  |
Top three noisy pixels from each quadrant. If the there are fewer than three noisy pixels in the level2.evt file, extra rows are filled as -1
| Pixel properties | Quadrant properties | ||||||
|---|---|---|---|---|---|---|---|
| Quadrant | DetID | PixID | Counts | Sigma | Mean | Median | Sigma |
| A | 13 | 170 | 178449 | 139.67 | 5710 | 5610 | 1237.5 |
| A | 13 | 254 | 167435 | 130.77 | 5710 | 5610 | 1237.5 |
| A | 13 | 248 | 90837 | 68.87 | 5710 | 5610 | 1237.5 |
| B | 10 | 245 | 4824860 | 4492.06 | 5700 | 5558 | 1072.8 |
| B | 15 | 32 | 255092 | 232.59 | 5700 | 5558 | 1072.8 |
| B | 0 | 190 | 251863 | 229.58 | 5700 | 5558 | 1072.8 |
| C | 3 | 233 | 4229823 | 3332.84 | 5411 | 5389 | 1267.5 |
| C | 15 | 208 | 439798 | 342.72 | 5411 | 5389 | 1267.5 |
| C | 2 | 16 | 71526 | 52.18 | 5411 | 5389 | 1267.5 |
| D | 1 | 52 | 14538593 | 11373.5 | 5508 | 5323 | 1277.8 |
| D | 2 | 250 | 1241272 | 967.23 | 5508 | 5323 | 1277.8 |
| D | 2 | 234 | 452825 | 350.21 | 5508 | 5323 | 1277.8 |
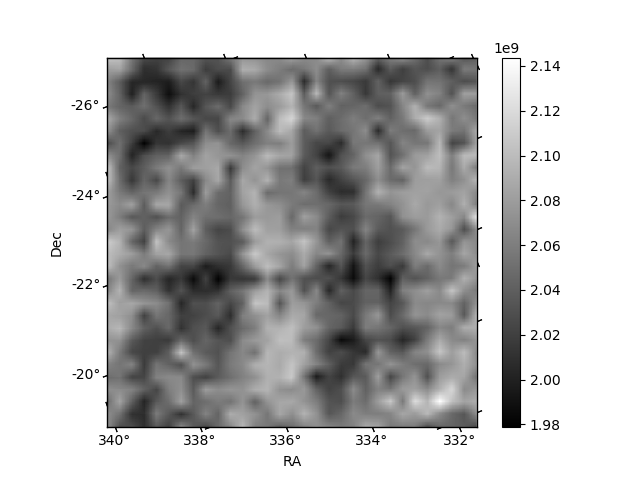
Histogram calculated using DETX and DETY for each event in the final _common_clean file
| Quadrant A |  |
 |
Quadrant B |
|---|---|---|---|
| Quadrant D |  |
 |
Quadrant C |
| Plot type | Count rate plots | Images |
|---|---|---|
| Comparison with Poisson distribution Blue bars denote a histogram of data divided into 1 sec bins. Red curve is a Poisson curve with rate = median count rate of data. |
 |
 |
| Quadrant-wise count rates Data is divided into 100 sec bins |
 |
|
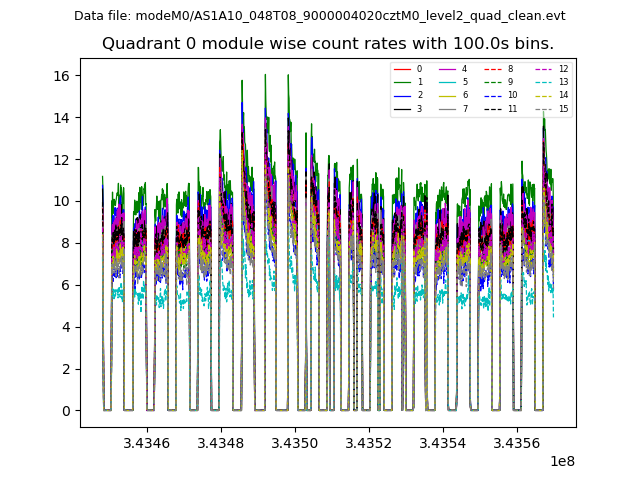
| Module-wise count rates for Quadrant A Data is divided into 100 sec bins |
 |
 |
| Module-wise count rates for Quadrant B Data is divided into 100 sec bins |
 |
 |
| Module-wise count rates for Quadrant C Data is divided into 100 sec bins |
 |
 |
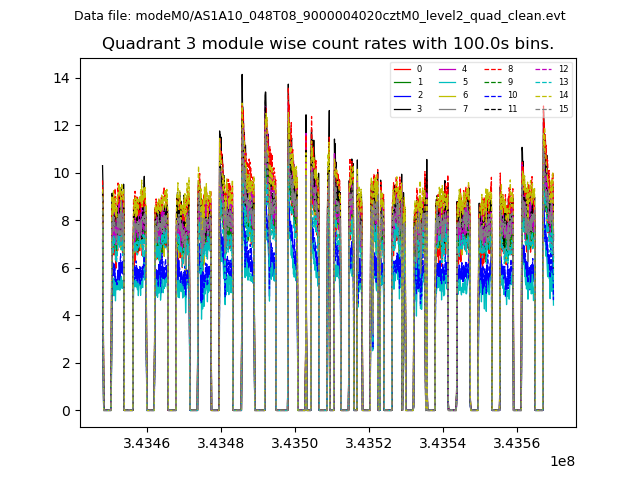
| Module-wise count rates for Quadrant D Data is divided into 100 sec bins |
 |
 |
| Parameter | Plot |
|---|---|
| CZT HV Monitor | 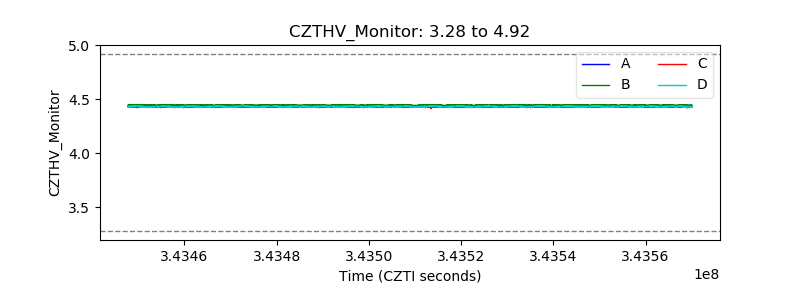 |
| D_VDD |  |
| Temperature 1 |  |
| Veto HV Monitor |  |
| Veto LLD |  |
| Alpha Counter |  |
| _CPM_Rate |  |
| CZT Counter |  |
| +2.5 Volts monitor |  |
| +5 Volts monitor |  |
| _ROLL_ROT | 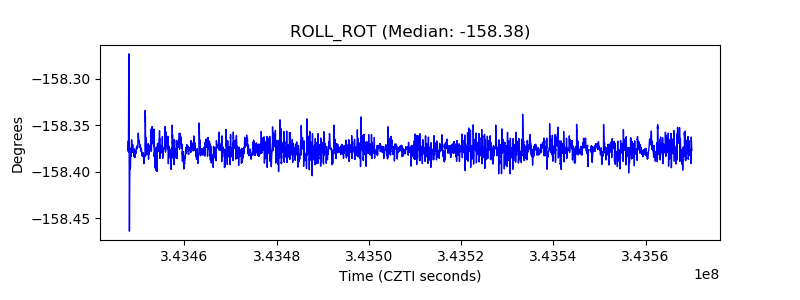 |
| _Roll_DEC |  |
| _Roll_RA |  |
| Veto Counter |  |