| Param | Original file | Final file |
|---|---|---|
| Filename | modeM0/AS1A10_016T02_9000004018cztM0_level2_bc.evt | modeM0/AS1A10_016T02_9000004018cztM0_level2_quad_clean.evt |
| Size (bytes) | 1,313,907,840 | 524,350,080 |
| Size | 1.2 GB | 500.1 MB |
| Events in quadrant A | 8,279,772 | 3,507,873 |
| Events in quadrant B | 11,119,821 | 3,439,677 |
| Events in quadrant C | 8,126,822 | 3,180,268 |
| Events in quadrant D | 9,749,798 | 3,224,392 |
| Mode M0 | |||
|---|---|---|---|
| Quadrant | BADHDUFLAG | Total packets | Discarded packets |
| A | 0 | 77924 | 0 |
| B | 0 | 89873 | 0 |
| C | 0 | 78878 | 0 |
| D | 0 | 81985 | 0 |
| Mode M9 | |||
|---|---|---|---|
| Quadrant | BADHDUFLAG | Total packets | Discarded packets |
| A | 0 | 72 | 0 |
| B | 0 | 72 | 0 |
| C | 0 | 72 | 0 |
| D | 0 | 72 | 0 |
| Mode SS | |||
|---|---|---|---|
| Quadrant | BADHDUFLAG | Total packets | Discarded packets |
| A | 0 | 752 | 0 |
| B | 0 | 752 | 0 |
| C | 0 | 752 | 0 |
| D | 0 | 752 | 0 |
| Quadrant | Total seconds | Saturated seconds | Saturation percentage |
|---|---|---|---|
| A | 36841 | 447 | 1.213322% |
| B | 36841 | 1874 | 5.086724% |
| C | 36841 | 694 | 1.883771% |
| D | 36841 | 563 | 1.528189% |
Noise dominated data is calculated using 1-second bins in cleaned event files. If a bin has >2000 counts, and if more than 50% of those come from <1% of pixels, then it is considered to be noise-dominated and hence unusable.
| Quadrant | # 1 sec bins | Bins with >0 counts | Bins with >2000 counts | High rate bins dominated by noise | Noise dominated (total time) | Noise dominated (detector-on time) | Marked lightcurve |
|---|---|---|---|---|---|---|---|
| A | 42946 | 36836 | 0 | 0 | 0.00% | 0.00% |  |
| B | 42946 | 36835 | 99 | 99 | 0.23% | 0.27% | 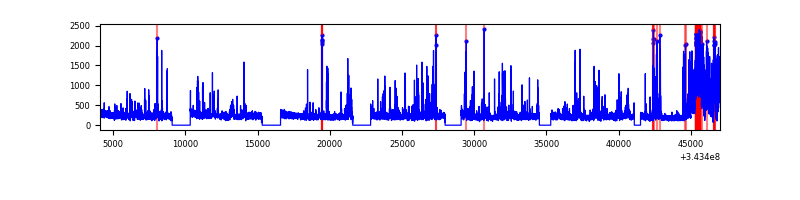 |
| C | 42946 | 36837 | 1 | 1 | 0.00% | 0.00% |  |
| D | 42946 | 36836 | 63 | 63 | 0.15% | 0.17% |  |
Top three noisy pixels from each quadrant. If the there are fewer than three noisy pixels in the level2.evt file, extra rows are filled as -1
| Pixel properties | Quadrant properties | ||||||
|---|---|---|---|---|---|---|---|
| Quadrant | DetID | PixID | Counts | Sigma | Mean | Median | Sigma |
| A | 13 | 254 | 51308 | 105.56 | 2151 | 2117 | 466.0 |
| A | 0 | 226 | 13181 | 23.74 | 2151 | 2117 | 466.0 |
| A | 12 | 194 | 12548 | 22.38 | 2151 | 2117 | 466.0 |
| B | 10 | 245 | 2795300 | 6682.12 | 2121 | 2063 | 418.0 |
| B | 3 | 64 | 79757 | 185.86 | 2121 | 2063 | 418.0 |
| B | 0 | 190 | 67815 | 157.29 | 2121 | 2063 | 418.0 |
| C | 3 | 233 | 337983 | 727.97 | 1989 | 1981 | 461.6 |
| C | 10 | 22 | 58558 | 122.58 | 1989 | 1981 | 461.6 |
| C | 6 | 112 | 45907 | 95.17 | 1989 | 1981 | 461.6 |
| D | 1 | 52 | 1813205 | 3844.9 | 2068 | 2006 | 471.1 |
| D | 2 | 234 | 142127 | 297.46 | 2068 | 2006 | 471.1 |
| D | 14 | 35 | 20041 | 38.29 | 2068 | 2006 | 471.1 |
Histogram calculated using DETX and DETY for each event in the final _common_clean file
| Quadrant A | 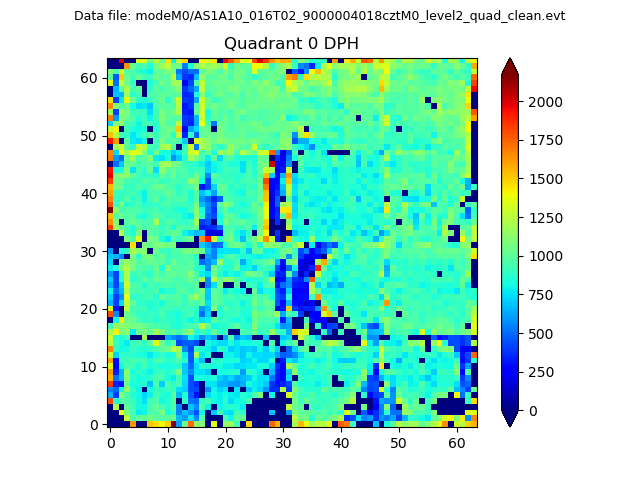 |
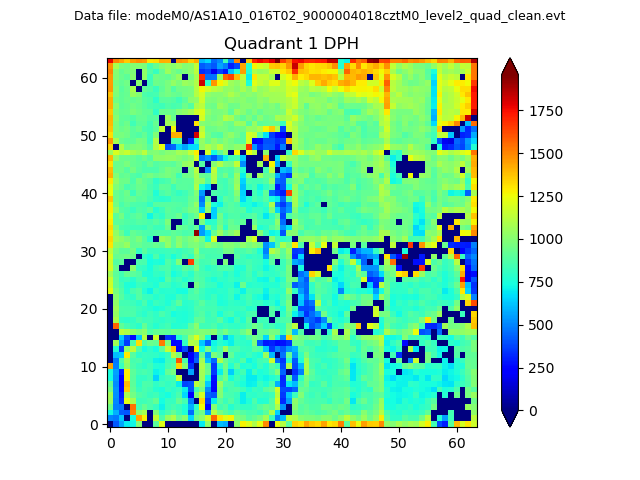 |
Quadrant B |
|---|---|---|---|
| Quadrant D |  |
 |
Quadrant C |
| Plot type | Count rate plots | Images |
|---|---|---|
| Comparison with Poisson distribution Blue bars denote a histogram of data divided into 1 sec bins. Red curve is a Poisson curve with rate = median count rate of data. |
 |
 |
| Quadrant-wise count rates Data is divided into 100 sec bins |
 |
|
| Module-wise count rates for Quadrant A Data is divided into 100 sec bins |
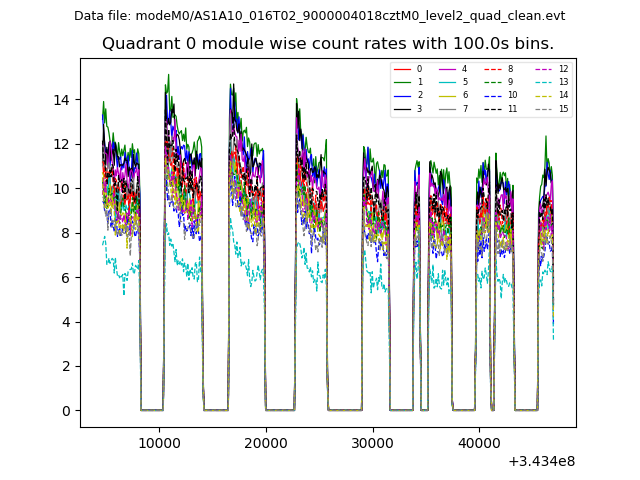 |
 |
| Module-wise count rates for Quadrant B Data is divided into 100 sec bins |
 |
 |
| Module-wise count rates for Quadrant C Data is divided into 100 sec bins |
 |
 |
| Module-wise count rates for Quadrant D Data is divided into 100 sec bins |
 |
 |
| Parameter | Plot |
|---|---|
| CZT HV Monitor |  |
| D_VDD |  |
| Temperature 1 | 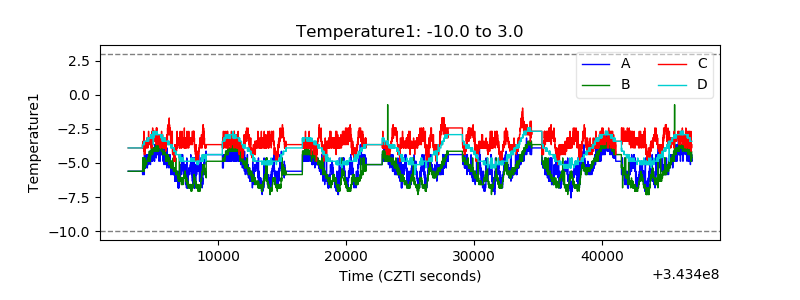 |
| Veto HV Monitor |  |
| Veto LLD |  |
| Alpha Counter | 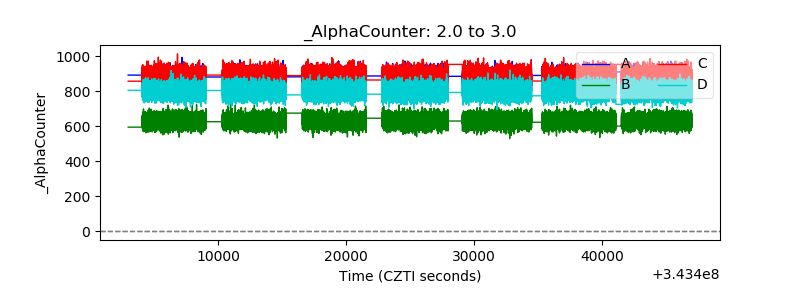 |
| _CPM_Rate | 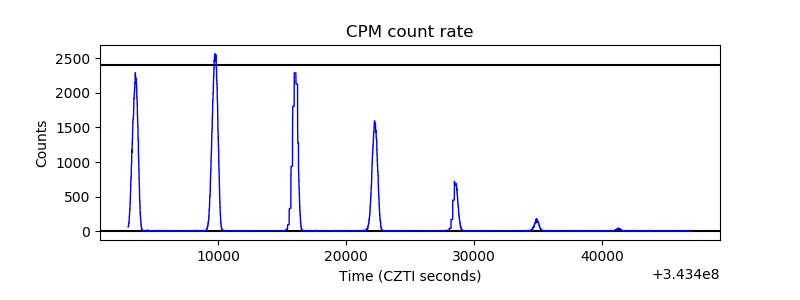 |
| CZT Counter | 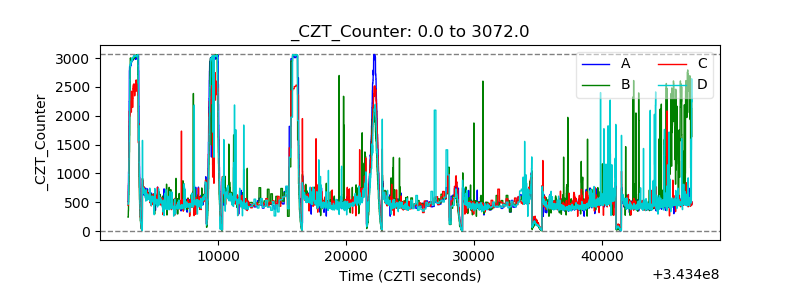 |
| +2.5 Volts monitor | 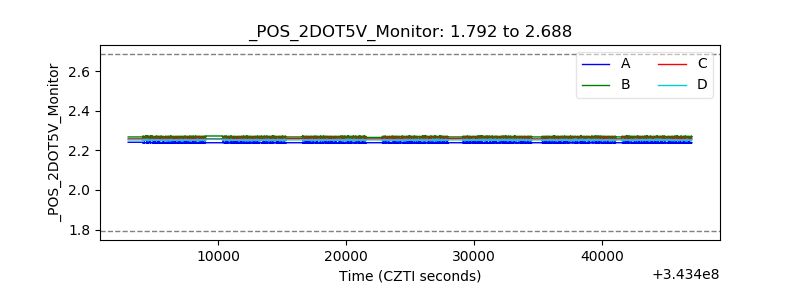 |
| +5 Volts monitor |  |
| _ROLL_ROT |  |
| _Roll_DEC |  |
| _Roll_RA | 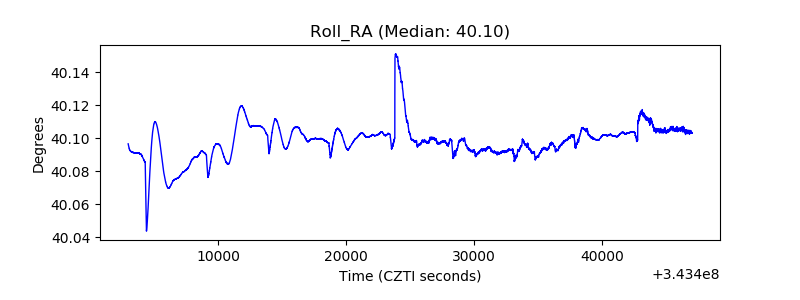 |
| Veto Counter |  |