| Param | Original file | Final file |
|---|---|---|
| Filename | modeM0/AS1A10_016T01_9000004016cztM0_level2_bc.evt | modeM0/AS1A10_016T01_9000004016cztM0_level2_quad_clean.evt |
| Size (bytes) | 5,353,954,560 | 1,590,085,440 |
| Size | 5.0 GB | 1.5 GB |
| Events in quadrant A | 27,098,549 | 10,174,517 |
| Events in quadrant B | 35,354,086 | 10,212,301 |
| Events in quadrant C | 28,102,730 | 9,873,076 |
| Events in quadrant D | 62,999,228 | 9,253,612 |
| Mode M9 | |||
|---|---|---|---|
| Quadrant | BADHDUFLAG | Total packets | Discarded packets |
| A | 0 | 184 | 0 |
| B | 0 | 184 | 0 |
| C | 0 | 184 | 0 |
| D | 0 | 184 | 0 |
| Mode SS | |||
|---|---|---|---|
| Quadrant | BADHDUFLAG | Total packets | Discarded packets |
| A | 0 | 2568 | 0 |
| B | 0 | 2568 | 0 |
| C | 0 | 2568 | 0 |
| D | 0 | 2568 | 0 |
| Mode M0 | |||
|---|---|---|---|
| Quadrant | BADHDUFLAG | Total packets | Discarded packets |
| A | 0 | 264949 | 0 |
| B | 0 | 297119 | 0 |
| C | 0 | 273583 | 0 |
| D | 0 | 402692 | 0 |
| Quadrant | Total seconds | Saturated seconds | Saturation percentage |
|---|---|---|---|
| A | 126207 | 1485 | 1.176638% |
| B | 126207 | 4141 | 3.281118% |
| C | 126207 | 2567 | 2.033960% |
| D | 126207 | 14280 | 11.314745% |
Noise dominated data is calculated using 1-second bins in cleaned event files. If a bin has >2000 counts, and if more than 50% of those come from <1% of pixels, then it is considered to be noise-dominated and hence unusable.
| Quadrant | # 1 sec bins | Bins with >0 counts | Bins with >2000 counts | High rate bins dominated by noise | Noise dominated (total time) | Noise dominated (detector-on time) | Marked lightcurve |
|---|---|---|---|---|---|---|---|
| A | 144523 | 126199 | 21 | 21 | 0.01% | 0.02% |  |
| B | 144523 | 126186 | 261 | 261 | 0.18% | 0.21% |  |
| C | 144523 | 126189 | 6 | 6 | 0.00% | 0.00% |  |
| D | 144523 | 126188 | 4008 | 4008 | 2.77% | 3.18% |  |
Top three noisy pixels from each quadrant. If the there are fewer than three noisy pixels in the level2.evt file, extra rows are filled as -1
| Pixel properties | Quadrant properties | ||||||
|---|---|---|---|---|---|---|---|
| Quadrant | DetID | PixID | Counts | Sigma | Mean | Median | Sigma |
| A | 6 | 16 | 400220 | 265.63 | 6880 | 6767 | 1481.2 |
| A | 13 | 254 | 206198 | 134.64 | 6880 | 6767 | 1481.2 |
| A | 13 | 248 | 50798 | 29.73 | 6880 | 6767 | 1481.2 |
| B | 3 | 64 | 5430845 | 4225.36 | 6849 | 6685 | 1283.7 |
| B | 10 | 245 | 1918007 | 1488.9 | 6849 | 6685 | 1283.7 |
| B | 10 | 246 | 690324 | 532.55 | 6849 | 6685 | 1283.7 |
| C | 3 | 233 | 2439286 | 1563.56 | 6630 | 6601 | 1555.9 |
| C | 4 | 175 | 96628 | 57.86 | 6630 | 6601 | 1555.9 |
| C | 13 | 61 | 37768 | 20.03 | 6630 | 6601 | 1555.9 |
| D | 1 | 52 | 28230957 | 18673.29 | 6413 | 6186 | 1511.5 |
| D | 11 | 248 | 3969864 | 2622.34 | 6413 | 6186 | 1511.5 |
| D | 2 | 250 | 1782084 | 1174.92 | 6413 | 6186 | 1511.5 |
Histogram calculated using DETX and DETY for each event in the final _common_clean file
| Quadrant A |  |
 |
Quadrant B |
|---|---|---|---|
| Quadrant D | 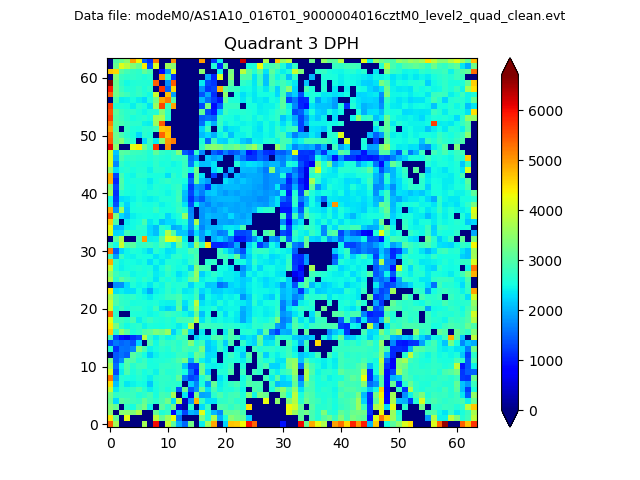 |
 |
Quadrant C |
| Plot type | Count rate plots | Images |
|---|---|---|
| Comparison with Poisson distribution Blue bars denote a histogram of data divided into 1 sec bins. Red curve is a Poisson curve with rate = median count rate of data. |
 |
 |
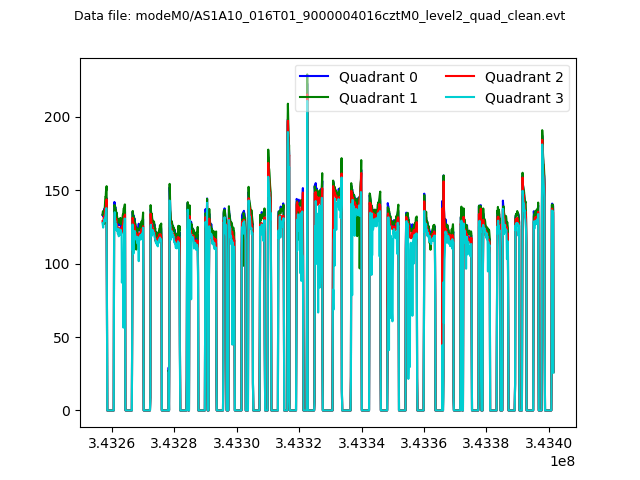
| Quadrant-wise count rates Data is divided into 100 sec bins |
 |
|
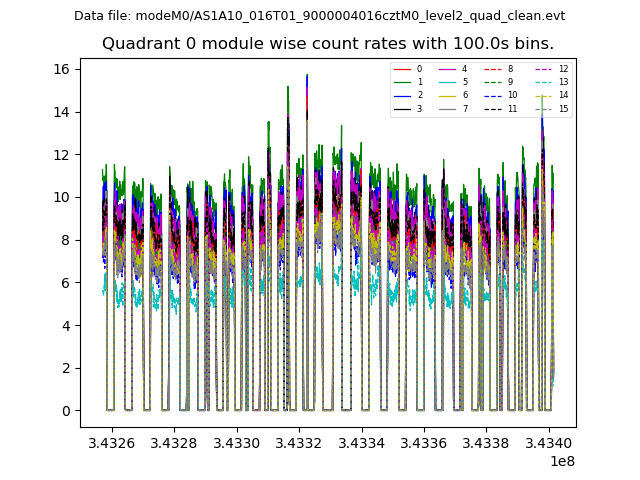
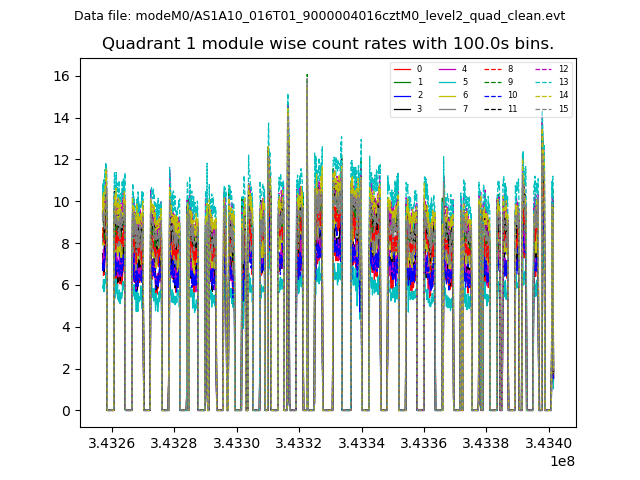
| Module-wise count rates for Quadrant A Data is divided into 100 sec bins |
 |
 |
| Module-wise count rates for Quadrant B Data is divided into 100 sec bins |
 |
 |
| Module-wise count rates for Quadrant C Data is divided into 100 sec bins |
 |
 |
| Module-wise count rates for Quadrant D Data is divided into 100 sec bins |
 |
 |
| Parameter | Plot |
|---|---|
| CZT HV Monitor |  |
| D_VDD | 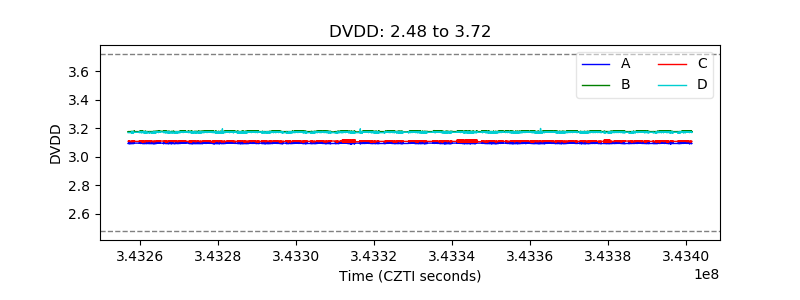 |
| Temperature 1 |  |
| Veto HV Monitor |  |
| Veto LLD |  |
| Alpha Counter |  |
| _CPM_Rate |  |
| CZT Counter | 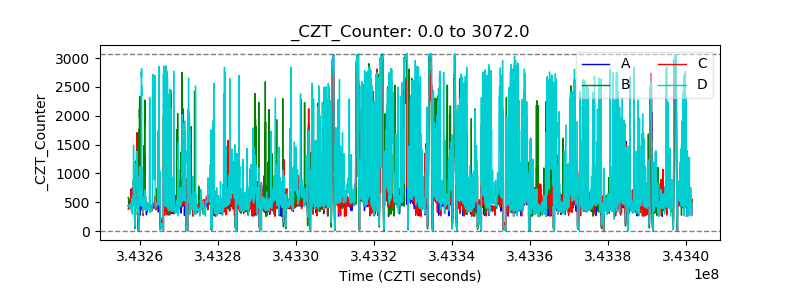 |
| +2.5 Volts monitor | 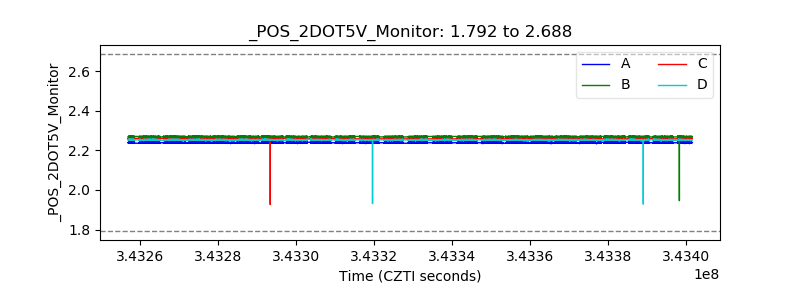 |
| +5 Volts monitor |  |
| _ROLL_ROT | 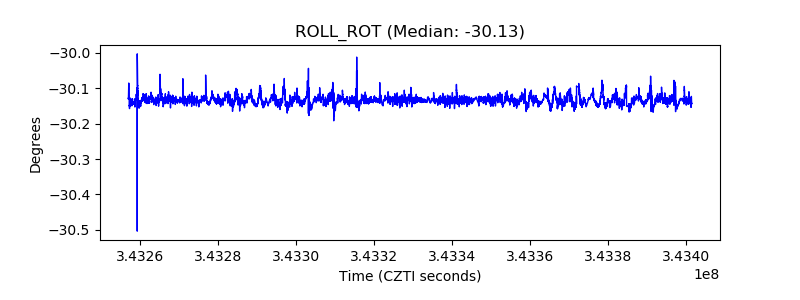 |
| _Roll_DEC |  |
| _Roll_RA |  |
| Veto Counter | 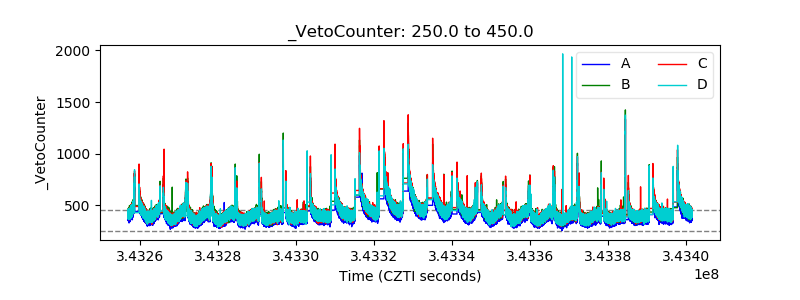 |