| Param | Original file | Final file |
|---|---|---|
| Filename | modeM0/AS1A10_009T02_9000004014cztM0_level2_bc.evt | modeM0/AS1A10_009T02_9000004014cztM0_level2_quad_clean.evt |
| Size (bytes) | 976,415,040 | 346,374,720 |
| Size | 931.2 MB | 330.3 MB |
| Events in quadrant A | 5,119,314 | 2,355,846 |
| Events in quadrant B | 7,617,663 | 2,364,195 |
| Events in quadrant C | 6,314,103 | 2,196,037 |
| Events in quadrant D | 9,018,514 | 2,063,268 |
| Mode M9 | |||
|---|---|---|---|
| Quadrant | BADHDUFLAG | Total packets | Discarded packets |
| A | 0 | 60 | 0 |
| B | 0 | 60 | 0 |
| C | 0 | 60 | 0 |
| D | 0 | 60 | 0 |
| Mode SS | |||
|---|---|---|---|
| Quadrant | BADHDUFLAG | Total packets | Discarded packets |
| A | 0 | 446 | 0 |
| B | 0 | 446 | 0 |
| C | 0 | 446 | 0 |
| D | 0 | 446 | 0 |
| Mode M0 | |||
|---|---|---|---|
| Quadrant | BADHDUFLAG | Total packets | Discarded packets |
| A | 0 | 47119 | 0 |
| B | 0 | 56883 | 0 |
| C | 0 | 52277 | 0 |
| D | 0 | 62079 | 0 |
| Quadrant | Total seconds | Saturated seconds | Saturation percentage |
|---|---|---|---|
| A | 21972 | 258 | 1.174222% |
| B | 21972 | 1001 | 4.555798% |
| C | 21972 | 560 | 2.548698% |
| D | 21972 | 1700 | 7.737120% |
Noise dominated data is calculated using 1-second bins in cleaned event files. If a bin has >2000 counts, and if more than 50% of those come from <1% of pixels, then it is considered to be noise-dominated and hence unusable.
| Quadrant | # 1 sec bins | Bins with >0 counts | Bins with >2000 counts | High rate bins dominated by noise | Noise dominated (total time) | Noise dominated (detector-on time) | Marked lightcurve |
|---|---|---|---|---|---|---|---|
| A | 27026 | 21967 | 0 | 0 | 0.00% | 0.00% |  |
| B | 27026 | 21968 | 89 | 89 | 0.33% | 0.41% |  |
| C | 27026 | 21967 | 6 | 6 | 0.02% | 0.03% |  |
| D | 27026 | 21972 | 556 | 556 | 2.06% | 2.53% |  |
Top three noisy pixels from each quadrant. If the there are fewer than three noisy pixels in the level2.evt file, extra rows are filled as -1
| Pixel properties | Quadrant properties | ||||||
|---|---|---|---|---|---|---|---|
| Quadrant | DetID | PixID | Counts | Sigma | Mean | Median | Sigma |
| A | 13 | 254 | 34889 | 118.7 | 1319 | 1298 | 283.0 |
| A | 8 | 192 | 29565 | 99.89 | 1319 | 1298 | 283.0 |
| A | 0 | 226 | 8363 | 24.97 | 1319 | 1298 | 283.0 |
| B | 3 | 64 | 2286374 | 9280.57 | 1314 | 1287 | 246.2 |
| B | 5 | 255 | 90444 | 362.1 | 1314 | 1287 | 246.2 |
| B | 4 | 52 | 85377 | 341.52 | 1314 | 1287 | 246.2 |
| C | 3 | 233 | 1334899 | 4640.37 | 1230 | 1229 | 287.4 |
| C | 10 | 22 | 153507 | 529.84 | 1230 | 1229 | 287.4 |
| C | 6 | 112 | 85509 | 293.24 | 1230 | 1229 | 287.4 |
| D | 1 | 52 | 4067231 | 14708.76 | 1206 | 1172 | 276.4 |
| D | 2 | 250 | 90576 | 323.41 | 1206 | 1172 | 276.4 |
| D | 7 | 223 | 90520 | 323.21 | 1206 | 1172 | 276.4 |
Histogram calculated using DETX and DETY for each event in the final _common_clean file
| Quadrant A | 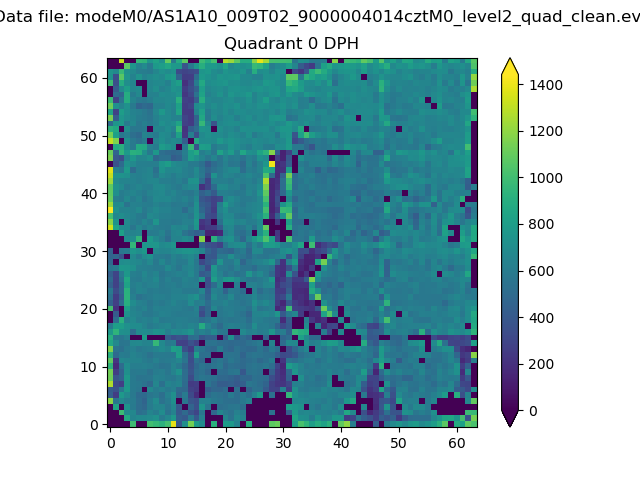 |
 |
Quadrant B |
|---|---|---|---|
| Quadrant D |  |
 |
Quadrant C |
| Plot type | Count rate plots | Images |
|---|---|---|
| Comparison with Poisson distribution Blue bars denote a histogram of data divided into 1 sec bins. Red curve is a Poisson curve with rate = median count rate of data. |
 |
 |
| Quadrant-wise count rates Data is divided into 100 sec bins |
 |
|
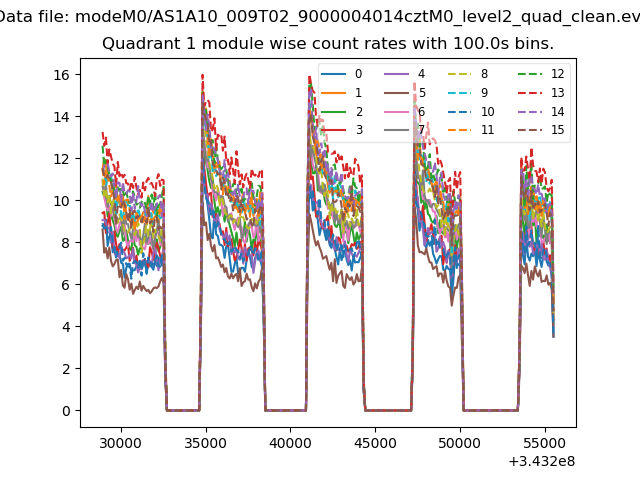
| Module-wise count rates for Quadrant A Data is divided into 100 sec bins |
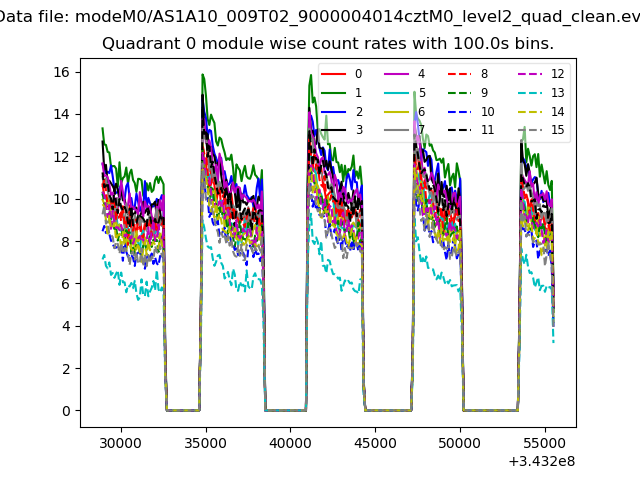 |
 |
| Module-wise count rates for Quadrant B Data is divided into 100 sec bins |
 |
 |
| Module-wise count rates for Quadrant C Data is divided into 100 sec bins |
 |
 |
| Module-wise count rates for Quadrant D Data is divided into 100 sec bins |
 |
 |
| Parameter | Plot |
|---|---|
| CZT HV Monitor | 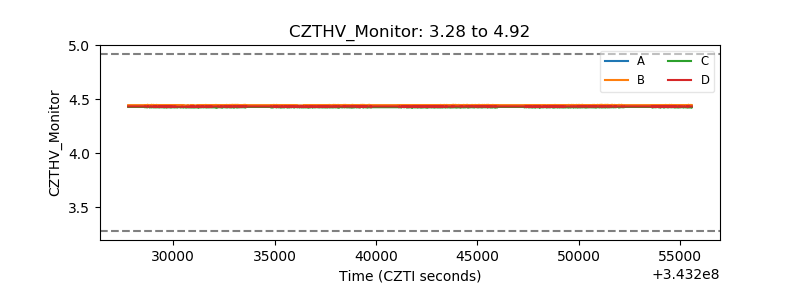 |
| D_VDD |  |
| Temperature 1 |  |
| Veto HV Monitor |  |
| Veto LLD |  |
| Alpha Counter |  |
| _CPM_Rate |  |
| CZT Counter |  |
| +2.5 Volts monitor |  |
| +5 Volts monitor | 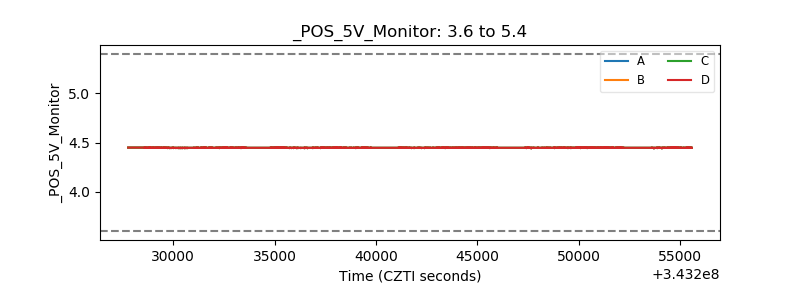 |
| _ROLL_ROT |  |
| _Roll_DEC |  |
| _Roll_RA |  |
| Veto Counter | 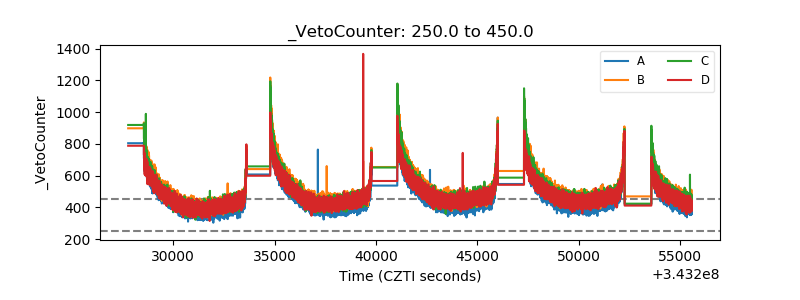 |