| Param | Original file | Final file |
|---|---|---|
| Filename | modeM0/AS1A09_038T34_9000004008cztM0_level2_bc.evt | modeM0/AS1A09_038T34_9000004008cztM0_level2_quad_clean.evt |
| Size (bytes) | 353,223,360 | 193,089,600 |
| Size | 336.9 MB | 184.1 MB |
| Events in quadrant A | 2,073,704 | 1,310,151 |
| Events in quadrant B | 2,353,260 | 1,323,859 |
| Events in quadrant C | 2,727,067 | 1,256,461 |
| Events in quadrant D | 2,827,348 | 1,238,003 |
| Mode M9 | |||
|---|---|---|---|
| Quadrant | BADHDUFLAG | Total packets | Discarded packets |
| A | 0 | 2 | 0 |
| B | 0 | 2 | 0 |
| C | 0 | 2 | 0 |
| D | 0 | 2 | 0 |
| Mode M0 | |||
|---|---|---|---|
| Quadrant | BADHDUFLAG | Total packets | Discarded packets |
| A | 0 | 21257 | 0 |
| B | 0 | 22024 | 0 |
| C | 0 | 23307 | 0 |
| D | 0 | 23598 | 0 |
| Mode SS | |||
|---|---|---|---|
| Quadrant | BADHDUFLAG | Total packets | Discarded packets |
| A | 0 | 212 | 0 |
| B | 0 | 212 | 0 |
| C | 0 | 212 | 0 |
| D | 0 | 212 | 0 |
| Quadrant | Total seconds | Saturated seconds | Saturation percentage |
|---|---|---|---|
| A | 10390 | 120 | 1.154957% |
| B | 10390 | 190 | 1.828681% |
| C | 10390 | 261 | 2.512031% |
| D | 10390 | 178 | 1.713186% |
Noise dominated data is calculated using 1-second bins in cleaned event files. If a bin has >2000 counts, and if more than 50% of those come from <1% of pixels, then it is considered to be noise-dominated and hence unusable.
| Quadrant | # 1 sec bins | Bins with >0 counts | Bins with >2000 counts | High rate bins dominated by noise | Noise dominated (total time) | Noise dominated (detector-on time) | Marked lightcurve |
|---|---|---|---|---|---|---|---|
| A | 10645 | 10391 | 0 | 0 | 0.00% | 0.00% |  |
| B | 10645 | 10389 | 7 | 7 | 0.07% | 0.07% |  |
| C | 10645 | 10390 | 3 | 3 | 0.03% | 0.03% |  |
| D | 10645 | 10389 | 23 | 23 | 0.22% | 0.22% |  |
Top three noisy pixels from each quadrant. If the there are fewer than three noisy pixels in the level2.evt file, extra rows are filled as -1
| Pixel properties | Quadrant properties | ||||||
|---|---|---|---|---|---|---|---|
| Quadrant | DetID | PixID | Counts | Sigma | Mean | Median | Sigma |
| A | 13 | 170 | 34617 | 288.09 | 525 | 515 | 118.4 |
| A | 13 | 254 | 17273 | 141.57 | 525 | 515 | 118.4 |
| A | 8 | 192 | 5952 | 45.93 | 525 | 515 | 118.4 |
| B | 3 | 64 | 151197 | 1457.13 | 527 | 514 | 103.4 |
| B | 0 | 190 | 38178 | 364.21 | 527 | 514 | 103.4 |
| B | 15 | 32 | 32205 | 306.45 | 527 | 514 | 103.4 |
| C | 3 | 233 | 754340 | 6211.55 | 501 | 498 | 121.4 |
| C | 2 | 16 | 26648 | 215.47 | 501 | 498 | 121.4 |
| C | 8 | 128 | 7765 | 59.88 | 501 | 498 | 121.4 |
| D | 1 | 52 | 529429 | 4312.72 | 513 | 493 | 122.6 |
| D | 2 | 250 | 155474 | 1263.65 | 513 | 493 | 122.6 |
| D | 14 | 35 | 89476 | 725.53 | 513 | 493 | 122.6 |
Histogram calculated using DETX and DETY for each event in the final _common_clean file
| Quadrant A |  |
 |
Quadrant B |
|---|---|---|---|
| Quadrant D |  |
 |
Quadrant C |
| Plot type | Count rate plots | Images |
|---|---|---|
| Comparison with Poisson distribution Blue bars denote a histogram of data divided into 1 sec bins. Red curve is a Poisson curve with rate = median count rate of data. |
 |
 |
| Quadrant-wise count rates Data is divided into 100 sec bins |
 |
|
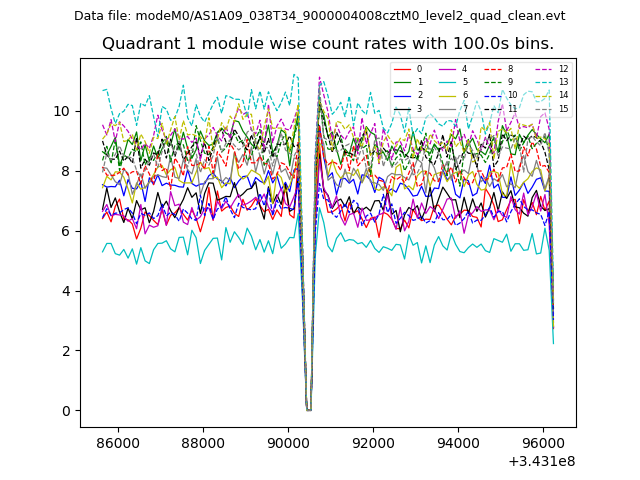
| Module-wise count rates for Quadrant A Data is divided into 100 sec bins |
 |
 |
| Module-wise count rates for Quadrant B Data is divided into 100 sec bins |
 |
 |
| Module-wise count rates for Quadrant C Data is divided into 100 sec bins |
 |
 |
| Module-wise count rates for Quadrant D Data is divided into 100 sec bins |
 |
 |
| Parameter | Plot |
|---|---|
| CZT HV Monitor |  |
| D_VDD |  |
| Temperature 1 | 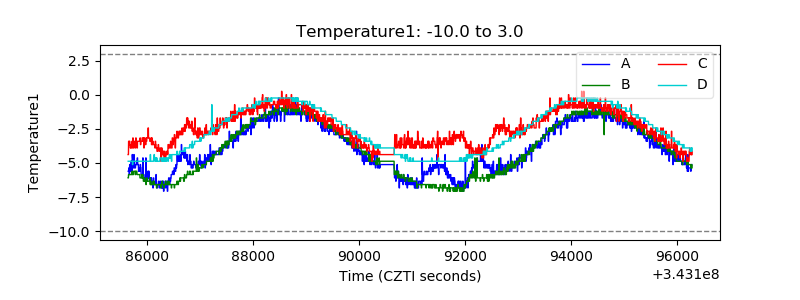 |
| Veto HV Monitor |  |
| Veto LLD |  |
| Alpha Counter |  |
| _CPM_Rate |  |
| CZT Counter |  |
| +2.5 Volts monitor |  |
| +5 Volts monitor |  |
| _ROLL_ROT |  |
| _Roll_DEC |  |
| _Roll_RA |  |
| Veto Counter |  |