| Param | Original file | Final file |
|---|---|---|
| Filename | modeM0/AS1A09_038T35_9000004006cztM0_level2_bc.evt | modeM0/AS1A09_038T35_9000004006cztM0_level2_quad_clean.evt |
| Size (bytes) | 397,065,600 | 186,304,320 |
| Size | 378.7 MB | 177.7 MB |
| Events in quadrant A | 2,534,984 | 1,270,060 |
| Events in quadrant B | 3,573,181 | 1,274,242 |
| Events in quadrant C | 2,630,236 | 1,226,970 |
| Events in quadrant D | 2,620,902 | 1,201,273 |
| Mode SS | |||
|---|---|---|---|
| Quadrant | BADHDUFLAG | Total packets | Discarded packets |
| A | 0 | 200 | 0 |
| B | 0 | 200 | 0 |
| C | 0 | 200 | 0 |
| D | 0 | 200 | 0 |
| Mode M9 | |||
|---|---|---|---|
| Quadrant | BADHDUFLAG | Total packets | Discarded packets |
| A | 0 | 16 | 0 |
| B | 0 | 16 | 0 |
| C | 0 | 16 | 0 |
| D | 0 | 16 | 0 |
| Mode M0 | |||
|---|---|---|---|
| Quadrant | BADHDUFLAG | Total packets | Discarded packets |
| A | 0 | 21489 | 0 |
| B | 0 | 25151 | 0 |
| C | 0 | 22234 | 0 |
| D | 0 | 21935 | 0 |
| Quadrant | Total seconds | Saturated seconds | Saturation percentage |
|---|---|---|---|
| A | 9661 | 167 | 1.728600% |
| B | 9661 | 460 | 4.761412% |
| C | 9661 | 187 | 1.935617% |
| D | 9661 | 171 | 1.770003% |
Noise dominated data is calculated using 1-second bins in cleaned event files. If a bin has >2000 counts, and if more than 50% of those come from <1% of pixels, then it is considered to be noise-dominated and hence unusable.
| Quadrant | # 1 sec bins | Bins with >0 counts | Bins with >2000 counts | High rate bins dominated by noise | Noise dominated (total time) | Noise dominated (detector-on time) | Marked lightcurve |
|---|---|---|---|---|---|---|---|
| A | 11356 | 9661 | 24 | 24 | 0.21% | 0.25% | 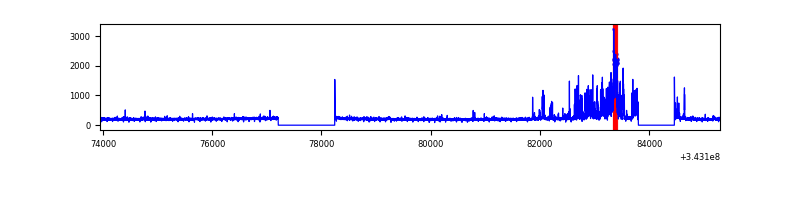 |
| B | 11356 | 9660 | 97 | 97 | 0.85% | 1.00% |  |
| C | 11356 | 9662 | 1 | 1 | 0.01% | 0.01% |  |
| D | 11356 | 9661 | 59 | 59 | 0.52% | 0.61% |  |
Top three noisy pixels from each quadrant. If the there are fewer than three noisy pixels in the level2.evt file, extra rows are filled as -1
| Pixel properties | Quadrant properties | ||||||
|---|---|---|---|---|---|---|---|
| Quadrant | DetID | PixID | Counts | Sigma | Mean | Median | Sigma |
| A | 13 | 170 | 473781 | 4119.05 | 510 | 501 | 114.9 |
| A | 6 | 16 | 78148 | 675.78 | 510 | 501 | 114.9 |
| A | 13 | 254 | 15908 | 134.09 | 510 | 501 | 114.9 |
| B | 3 | 64 | 1234961 | 12542.74 | 509 | 497 | 98.4 |
| B | 10 | 245 | 146640 | 1484.88 | 509 | 497 | 98.4 |
| B | 5 | 172 | 67464 | 680.42 | 509 | 497 | 98.4 |
| C | 3 | 233 | 743211 | 6266.57 | 489 | 487 | 118.5 |
| C | 8 | 128 | 2999 | 21.19 | 489 | 487 | 118.5 |
| C | 13 | 61 | 2839 | 19.84 | 489 | 487 | 118.5 |
| D | 1 | 52 | 230354 | 1937.79 | 498 | 481 | 118.6 |
| D | 2 | 250 | 172698 | 1451.76 | 498 | 481 | 118.6 |
| D | 7 | 69 | 80071 | 670.93 | 498 | 481 | 118.6 |
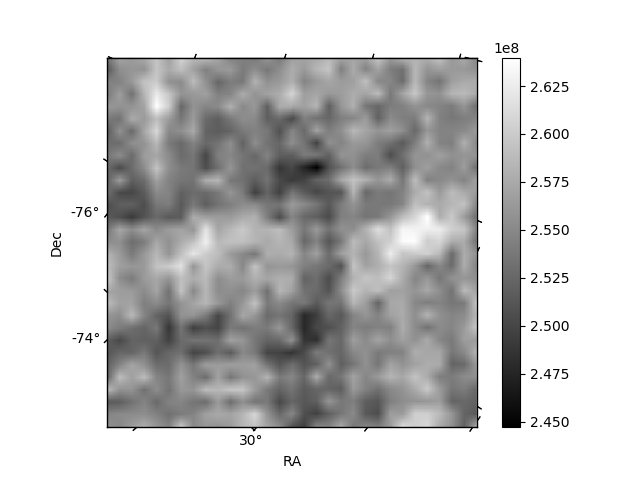
Histogram calculated using DETX and DETY for each event in the final _common_clean file
| Quadrant A | 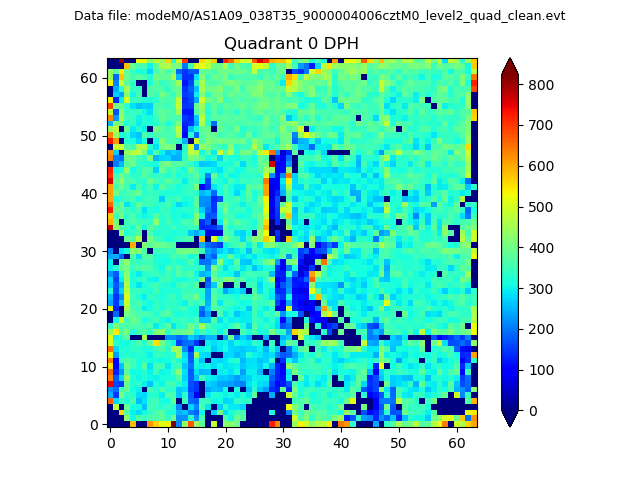 |
 |
Quadrant B |
|---|---|---|---|
| Quadrant D | 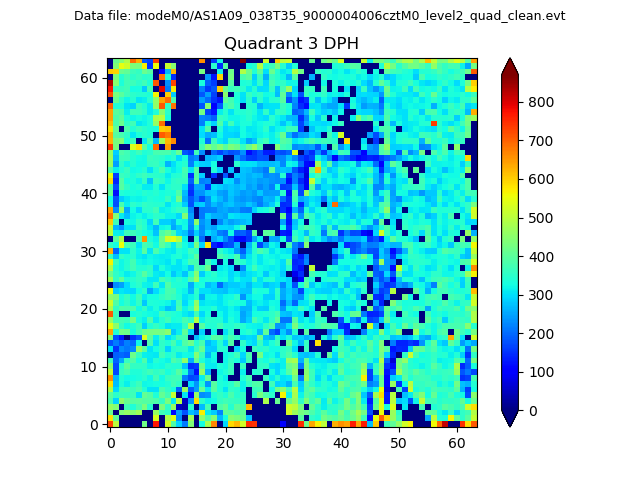 |
 |
Quadrant C |
| Plot type | Count rate plots | Images |
|---|---|---|
| Comparison with Poisson distribution Blue bars denote a histogram of data divided into 1 sec bins. Red curve is a Poisson curve with rate = median count rate of data. |
 |
 |
| Quadrant-wise count rates Data is divided into 100 sec bins |
 |
|
| Module-wise count rates for Quadrant A Data is divided into 100 sec bins |
 |
 |
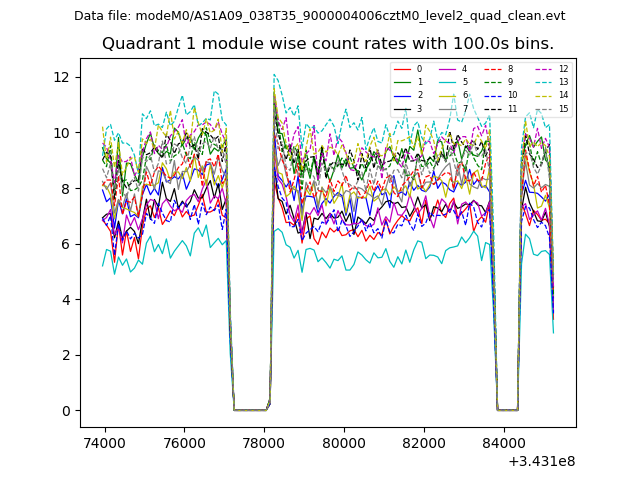
| Module-wise count rates for Quadrant B Data is divided into 100 sec bins |
 |
 |
| Module-wise count rates for Quadrant C Data is divided into 100 sec bins |
 |
 |
| Module-wise count rates for Quadrant D Data is divided into 100 sec bins |
 |
 |
| Parameter | Plot |
|---|---|
| CZT HV Monitor |  |
| D_VDD |  |
| Temperature 1 | 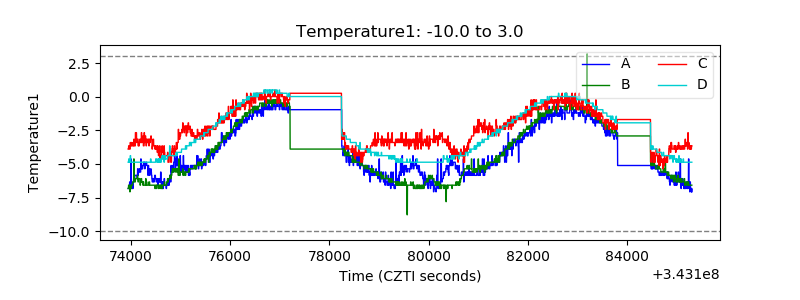 |
| Veto HV Monitor | 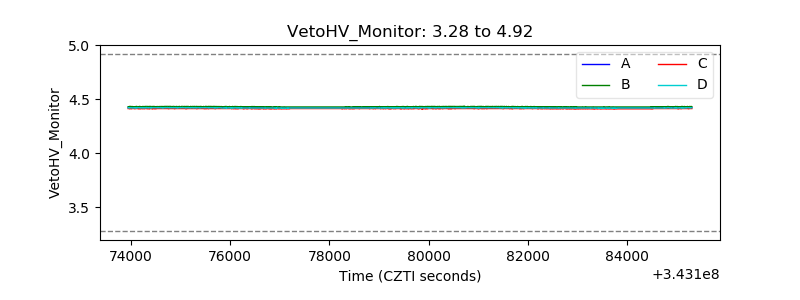 |
| Veto LLD |  |
| Alpha Counter |  |
| _CPM_Rate |  |
| CZT Counter | 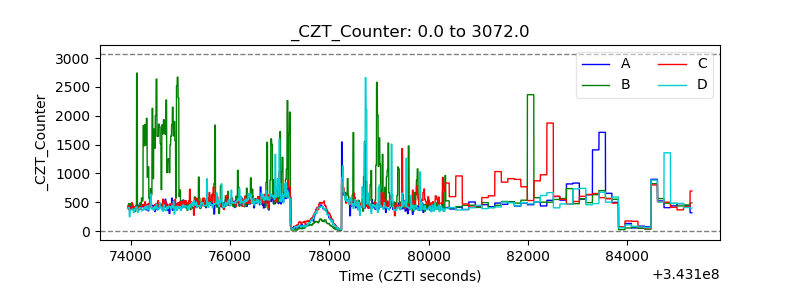 |
| +2.5 Volts monitor | 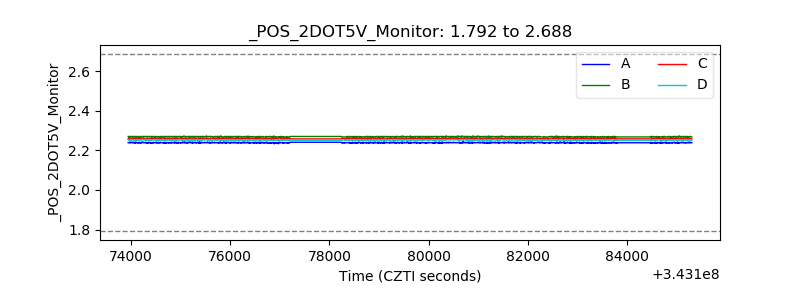 |
| +5 Volts monitor |  |
| _ROLL_ROT |  |
| _Roll_DEC |  |
| _Roll_RA | 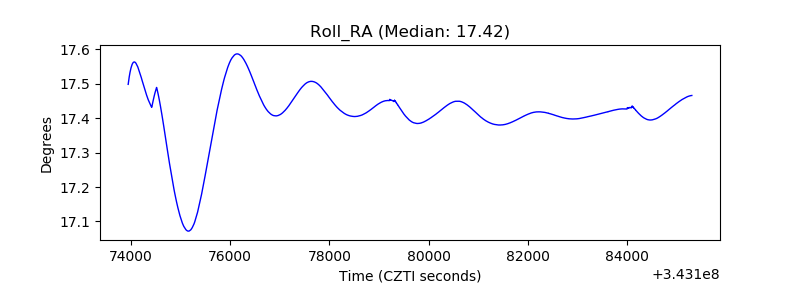 |
| Veto Counter |  |