| Param | Original file | Final file |
|---|---|---|
| Filename | modeM0/AS1A10_002T05_9000004000cztM0_level2_bc.evt | modeM0/AS1A10_002T05_9000004000cztM0_level2_quad_clean.evt |
| Size (bytes) | 3,659,837,760 | 1,394,697,600 |
| Size | 3.4 GB | 1.3 GB |
| Events in quadrant A | 22,280,120 | 9,200,666 |
| Events in quadrant B | 28,069,158 | 8,986,105 |
| Events in quadrant C | 24,709,500 | 8,828,706 |
| Events in quadrant D | 29,225,974 | 8,634,115 |
| Mode SS | |||
|---|---|---|---|
| Quadrant | BADHDUFLAG | Total packets | Discarded packets |
| A | 0 | 1960 | 0 |
| B | 0 | 1960 | 0 |
| C | 0 | 1960 | 0 |
| D | 0 | 1960 | 0 |
| Mode M9 | |||
|---|---|---|---|
| Quadrant | BADHDUFLAG | Total packets | Discarded packets |
| A | 0 | 169 | 0 |
| B | 0 | 169 | 0 |
| C | 0 | 169 | 0 |
| D | 0 | 169 | 0 |
| Mode M0 | |||
|---|---|---|---|
| Quadrant | BADHDUFLAG | Total packets | Discarded packets |
| A | 0 | 205581 | 0 |
| B | 0 | 232051 | 0 |
| C | 0 | 216822 | 0 |
| D | 0 | 229867 | 0 |
| Quadrant | Total seconds | Saturated seconds | Saturation percentage |
|---|---|---|---|
| A | 96252 | 1109 | 1.152184% |
| B | 96252 | 3905 | 4.057059% |
| C | 96252 | 2086 | 2.167228% |
| D | 96252 | 1924 | 1.998920% |
Noise dominated data is calculated using 1-second bins in cleaned event files. If a bin has >2000 counts, and if more than 50% of those come from <1% of pixels, then it is considered to be noise-dominated and hence unusable.
| Quadrant | # 1 sec bins | Bins with >0 counts | Bins with >2000 counts | High rate bins dominated by noise | Noise dominated (total time) | Noise dominated (detector-on time) | Marked lightcurve |
|---|---|---|---|---|---|---|---|
| A | 113082 | 96242 | 20 | 20 | 0.02% | 0.02% | 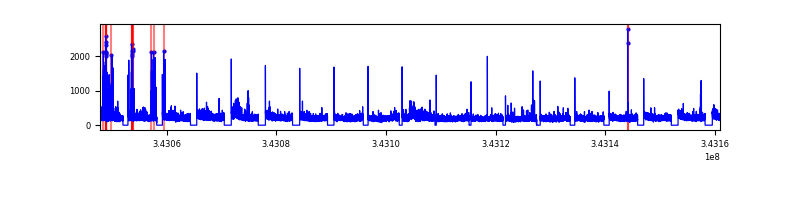 |
| B | 113082 | 96241 | 79 | 79 | 0.07% | 0.08% |  |
| C | 113082 | 96238 | 14 | 14 | 0.01% | 0.01% |  |
| D | 113082 | 96245 | 239 | 239 | 0.21% | 0.25% |  |
Top three noisy pixels from each quadrant. If the there are fewer than three noisy pixels in the level2.evt file, extra rows are filled as -1
| Pixel properties | Quadrant properties | ||||||
|---|---|---|---|---|---|---|---|
| Quadrant | DetID | PixID | Counts | Sigma | Mean | Median | Sigma |
| A | 0 | 13 | 1112933 | 966.78 | 5330 | 5252 | 1145.7 |
| A | 6 | 16 | 430055 | 370.77 | 5330 | 5252 | 1145.7 |
| A | 13 | 254 | 158411 | 133.68 | 5330 | 5252 | 1145.7 |
| B | 3 | 64 | 3992989 | 4107.72 | 5231 | 5122 | 970.8 |
| B | 10 | 245 | 2856606 | 2937.18 | 5231 | 5122 | 970.8 |
| B | 0 | 190 | 378679 | 384.78 | 5231 | 5122 | 970.8 |
| C | 3 | 233 | 4645503 | 3826.62 | 5104 | 5080 | 1212.7 |
| C | 10 | 22 | 210843 | 169.68 | 5104 | 5080 | 1212.7 |
| C | 15 | 208 | 131774 | 104.48 | 5104 | 5080 | 1212.7 |
| D | 1 | 52 | 6794108 | 5713.05 | 5220 | 5074 | 1188.3 |
| D | 2 | 250 | 1015249 | 850.07 | 5220 | 5074 | 1188.3 |
| D | 13 | 104 | 426164 | 354.35 | 5220 | 5074 | 1188.3 |
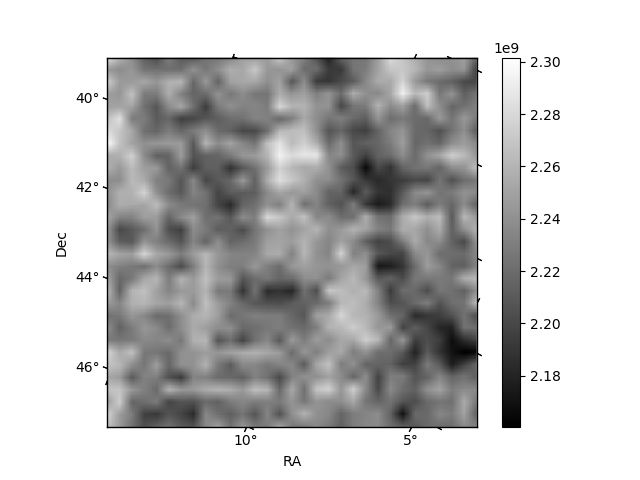
Histogram calculated using DETX and DETY for each event in the final _common_clean file
| Quadrant A | 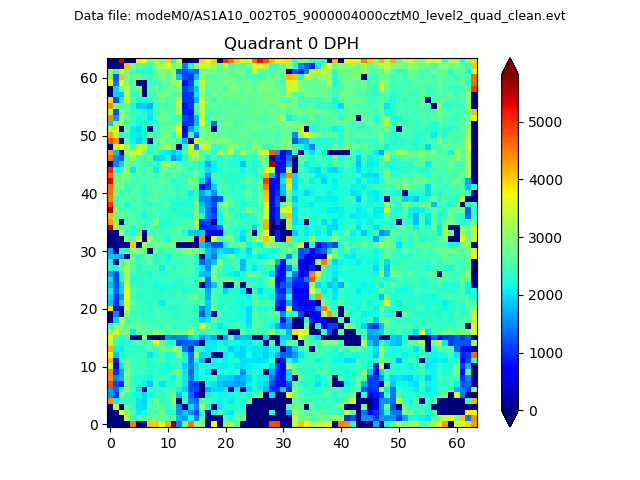 |
 |
Quadrant B |
|---|---|---|---|
| Quadrant D |  |
 |
Quadrant C |
| Plot type | Count rate plots | Images |
|---|---|---|
| Comparison with Poisson distribution Blue bars denote a histogram of data divided into 1 sec bins. Red curve is a Poisson curve with rate = median count rate of data. |
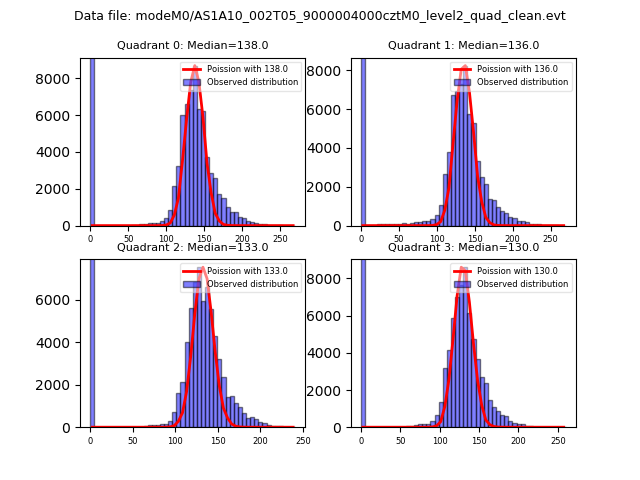 |
 |
| Quadrant-wise count rates Data is divided into 100 sec bins |
 |
|
| Module-wise count rates for Quadrant A Data is divided into 100 sec bins |
 |
 |
| Module-wise count rates for Quadrant B Data is divided into 100 sec bins |
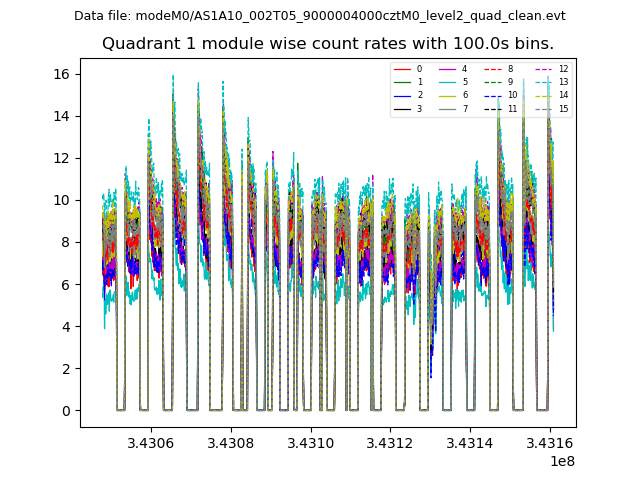 |
 |
| Module-wise count rates for Quadrant C Data is divided into 100 sec bins |
 |
 |
| Module-wise count rates for Quadrant D Data is divided into 100 sec bins |
 |
 |
| Parameter | Plot |
|---|---|
| CZT HV Monitor |  |
| D_VDD |  |
| Temperature 1 |  |
| Veto HV Monitor |  |
| Veto LLD |  |
| Alpha Counter |  |
| _CPM_Rate | 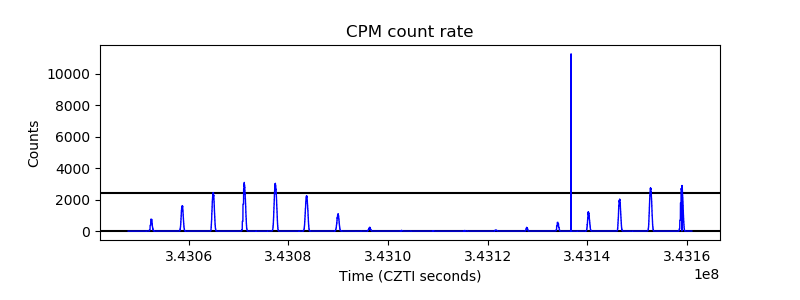 |
| CZT Counter |  |
| +2.5 Volts monitor | 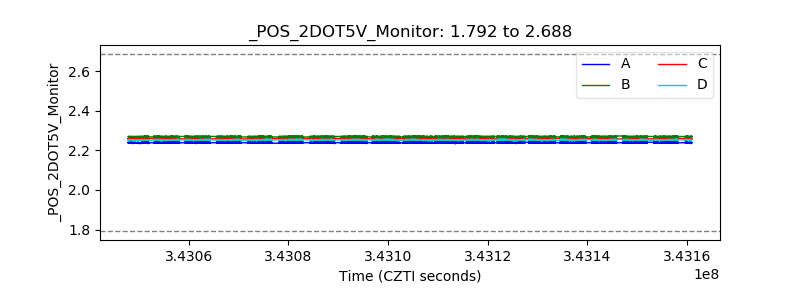 |
| +5 Volts monitor | 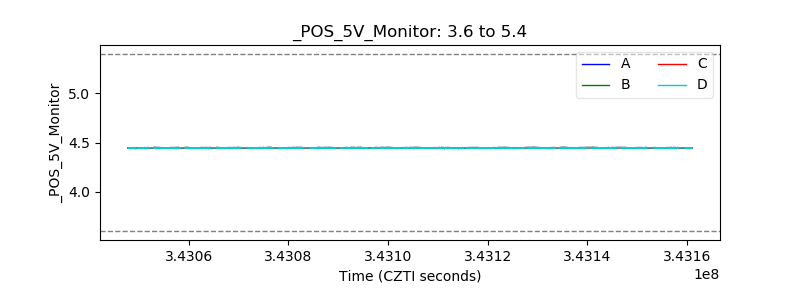 |
| _ROLL_ROT |  |
| _Roll_DEC | 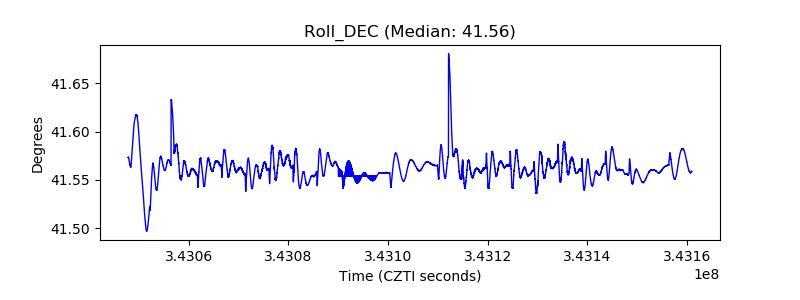 |
| _Roll_RA |  |
| Veto Counter |  |