| Param | Original file | Final file |
|---|---|---|
| Filename | modeM0/AS1A09_038T44_9000003996cztM0_level2_bc.evt | modeM0/AS1A09_038T44_9000003996cztM0_level2_quad_clean.evt |
| Size (bytes) | 245,986,560 | 111,574,080 |
| Size | 234.6 MB | 106.4 MB |
| Events in quadrant A | 1,399,059 | 751,182 |
| Events in quadrant B | 1,319,085 | 768,842 |
| Events in quadrant C | 2,073,232 | 724,750 |
| Events in quadrant D | 2,236,882 | 710,026 |
| Mode SS | |||
|---|---|---|---|
| Quadrant | BADHDUFLAG | Total packets | Discarded packets |
| A | 0 | 124 | 0 |
| B | 0 | 124 | 0 |
| C | 0 | 124 | 0 |
| D | 0 | 124 | 0 |
| Mode M9 | |||
|---|---|---|---|
| Quadrant | BADHDUFLAG | Total packets | Discarded packets |
| A | 0 | 10 | 0 |
| B | 0 | 10 | 0 |
| C | 0 | 10 | 0 |
| D | 0 | 10 | 0 |
| Mode M0 | |||
|---|---|---|---|
| Quadrant | BADHDUFLAG | Total packets | Discarded packets |
| A | 0 | 13163 | 0 |
| B | 0 | 12817 | 0 |
| C | 0 | 15538 | 0 |
| D | 0 | 15857 | 0 |
| Quadrant | Total seconds | Saturated seconds | Saturation percentage |
|---|---|---|---|
| A | 6079 | 189 | 3.109064% |
| B | 6079 | 160 | 2.632012% |
| C | 6079 | 322 | 5.296924% |
| D | 6079 | 297 | 4.885672% |
Noise dominated data is calculated using 1-second bins in cleaned event files. If a bin has >2000 counts, and if more than 50% of those come from <1% of pixels, then it is considered to be noise-dominated and hence unusable.
| Quadrant | # 1 sec bins | Bins with >0 counts | Bins with >2000 counts | High rate bins dominated by noise | Noise dominated (total time) | Noise dominated (detector-on time) | Marked lightcurve |
|---|---|---|---|---|---|---|---|
| A | 6463 | 6077 | 5 | 5 | 0.08% | 0.08% |  |
| B | 6463 | 6077 | 0 | 0 | 0.00% | 0.00% | 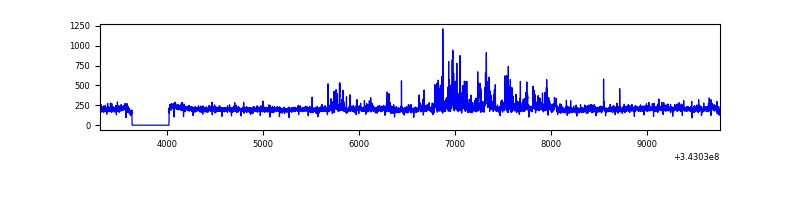 |
| C | 6463 | 6077 | 5 | 5 | 0.08% | 0.08% |  |
| D | 6463 | 6077 | 35 | 35 | 0.54% | 0.58% | 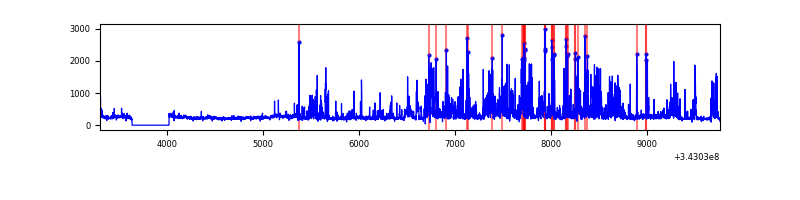 |
Top three noisy pixels from each quadrant. If the there are fewer than three noisy pixels in the level2.evt file, extra rows are filled as -1
| Pixel properties | Quadrant properties | ||||||
|---|---|---|---|---|---|---|---|
| Quadrant | DetID | PixID | Counts | Sigma | Mean | Median | Sigma |
| A | 0 | 13 | 223713 | 3252.65 | 301 | 295 | 68.7 |
| A | 13 | 254 | 10533 | 149.05 | 301 | 295 | 68.7 |
| A | 8 | 192 | 4928 | 67.45 | 301 | 295 | 68.7 |
| B | 0 | 229 | 67801 | 1086.22 | 307 | 299 | 62.1 |
| B | 0 | 190 | 25876 | 411.58 | 307 | 299 | 62.1 |
| B | 0 | 230 | 22295 | 353.95 | 307 | 299 | 62.1 |
| C | 3 | 233 | 917416 | 12760.13 | 290 | 286 | 71.9 |
| C | 15 | 208 | 39869 | 550.72 | 290 | 286 | 71.9 |
| C | 13 | 61 | 1591 | 18.16 | 290 | 286 | 71.9 |
| D | 1 | 52 | 887344 | 12471.26 | 296 | 285 | 71.1 |
| D | 2 | 250 | 103022 | 1444.39 | 296 | 285 | 71.1 |
| D | 7 | 80 | 32800 | 457.13 | 296 | 285 | 71.1 |
Histogram calculated using DETX and DETY for each event in the final _common_clean file
| Quadrant A |  |
 |
Quadrant B |
|---|---|---|---|
| Quadrant D |  |
 |
Quadrant C |
| Plot type | Count rate plots | Images |
|---|---|---|
| Comparison with Poisson distribution Blue bars denote a histogram of data divided into 1 sec bins. Red curve is a Poisson curve with rate = median count rate of data. |
 |
 |
| Quadrant-wise count rates Data is divided into 100 sec bins |
 |
|
| Module-wise count rates for Quadrant A Data is divided into 100 sec bins |
 |
 |
| Module-wise count rates for Quadrant B Data is divided into 100 sec bins |
 |
 |
| Module-wise count rates for Quadrant C Data is divided into 100 sec bins |
 |
 |
| Module-wise count rates for Quadrant D Data is divided into 100 sec bins |
 |
 |
| Parameter | Plot |
|---|---|
| CZT HV Monitor |  |
| D_VDD |  |
| Temperature 1 | 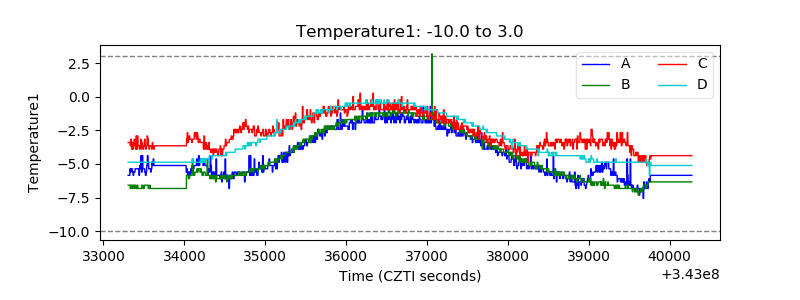 |
| Veto HV Monitor |  |
| Veto LLD |  |
| Alpha Counter |  |
| _CPM_Rate |  |
| CZT Counter |  |
| +2.5 Volts monitor |  |
| +5 Volts monitor |  |
| _ROLL_ROT |  |
| _Roll_DEC |  |
| _Roll_RA |  |
| Veto Counter | 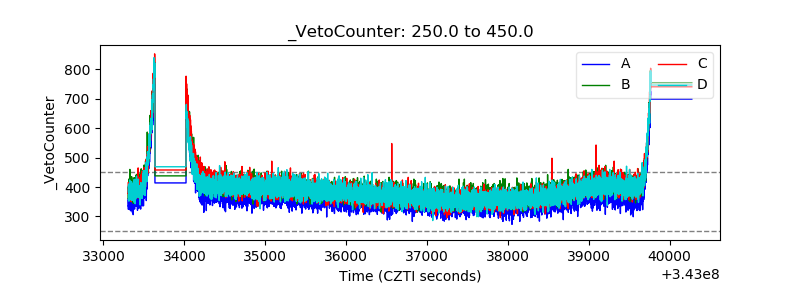 |