| Param | Original file | Final file |
|---|---|---|
| Filename | modeM0/AS1A09_038T43_9000003994cztM0_level2_bc.evt | modeM0/AS1A09_038T43_9000003994cztM0_level2_quad_clean.evt |
| Size (bytes) | 201,942,720 | 109,350,720 |
| Size | 192.6 MB | 104.3 MB |
| Events in quadrant A | 1,169,653 | 737,032 |
| Events in quadrant B | 1,192,912 | 751,314 |
| Events in quadrant C | 1,669,775 | 709,165 |
| Events in quadrant D | 1,672,817 | 701,451 |
| Mode M9 | |||
|---|---|---|---|
| Quadrant | BADHDUFLAG | Total packets | Discarded packets |
| A | 0 | 2 | 0 |
| B | 0 | 2 | 0 |
| C | 0 | 2 | 0 |
| D | 0 | 2 | 0 |
| Mode SS | |||
|---|---|---|---|
| Quadrant | BADHDUFLAG | Total packets | Discarded packets |
| A | 0 | 120 | 0 |
| B | 0 | 120 | 0 |
| C | 0 | 120 | 0 |
| D | 0 | 120 | 0 |
| Mode M0 | |||
|---|---|---|---|
| Quadrant | BADHDUFLAG | Total packets | Discarded packets |
| A | 0 | 12207 | 0 |
| B | 0 | 12199 | 0 |
| C | 0 | 13907 | 0 |
| D | 0 | 13698 | 0 |
| Quadrant | Total seconds | Saturated seconds | Saturation percentage |
|---|---|---|---|
| A | 5908 | 153 | 2.589709% |
| B | 5908 | 167 | 2.826676% |
| C | 5908 | 276 | 4.671632% |
| D | 5908 | 187 | 3.165200% |
Noise dominated data is calculated using 1-second bins in cleaned event files. If a bin has >2000 counts, and if more than 50% of those come from <1% of pixels, then it is considered to be noise-dominated and hence unusable.
| Quadrant | # 1 sec bins | Bins with >0 counts | Bins with >2000 counts | High rate bins dominated by noise | Noise dominated (total time) | Noise dominated (detector-on time) | Marked lightcurve |
|---|---|---|---|---|---|---|---|
| A | 6108 | 5907 | 0 | 0 | 0.00% | 0.00% |  |
| B | 6108 | 5907 | 0 | 0 | 0.00% | 0.00% |  |
| C | 6108 | 5908 | 4 | 4 | 0.07% | 0.07% |  |
| D | 6108 | 5908 | 1 | 1 | 0.02% | 0.02% |  |
Top three noisy pixels from each quadrant. If the there are fewer than three noisy pixels in the level2.evt file, extra rows are filled as -1
| Pixel properties | Quadrant properties | ||||||
|---|---|---|---|---|---|---|---|
| Quadrant | DetID | PixID | Counts | Sigma | Mean | Median | Sigma |
| A | 0 | 13 | 16990 | 248.33 | 295 | 289 | 67.3 |
| A | 13 | 254 | 10380 | 150.04 | 295 | 289 | 67.3 |
| A | 8 | 192 | 3299 | 44.76 | 295 | 289 | 67.3 |
| B | 0 | 229 | 12582 | 204.56 | 298 | 291 | 60.1 |
| B | 0 | 230 | 10730 | 173.74 | 298 | 291 | 60.1 |
| B | 4 | 200 | 8715 | 140.2 | 298 | 291 | 60.1 |
| C | 3 | 233 | 487606 | 7001.24 | 283 | 280 | 69.6 |
| C | 6 | 112 | 83252 | 1192.03 | 283 | 280 | 69.6 |
| C | 15 | 208 | 7150 | 98.7 | 283 | 280 | 69.6 |
| D | 1 | 52 | 245417 | 3518.79 | 290 | 278 | 69.7 |
| D | 11 | 176 | 186078 | 2667.02 | 290 | 278 | 69.7 |
| D | 2 | 250 | 60889 | 870.03 | 290 | 278 | 69.7 |
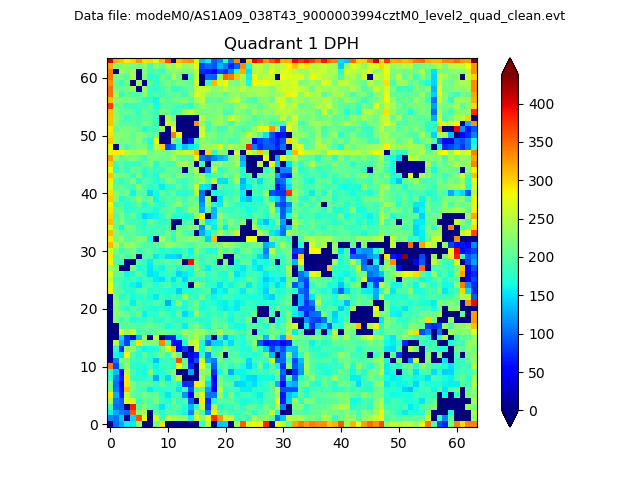
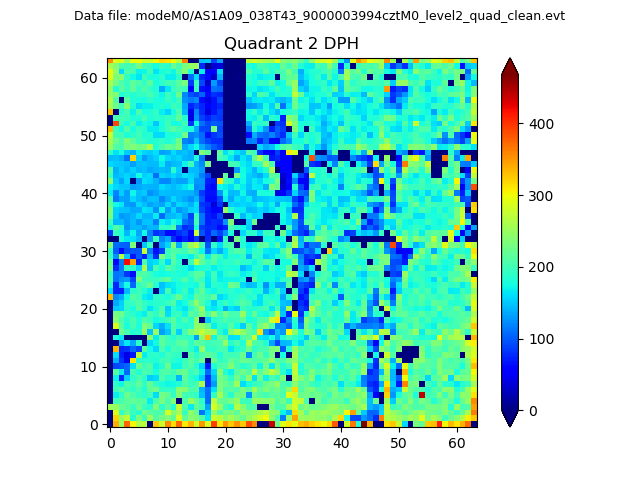
Histogram calculated using DETX and DETY for each event in the final _common_clean file
| Quadrant A |  |
 |
Quadrant B |
|---|---|---|---|
| Quadrant D |  |
 |
Quadrant C |
| Plot type | Count rate plots | Images |
|---|---|---|
| Comparison with Poisson distribution Blue bars denote a histogram of data divided into 1 sec bins. Red curve is a Poisson curve with rate = median count rate of data. |
 |
 |
| Quadrant-wise count rates Data is divided into 100 sec bins |
 |
|
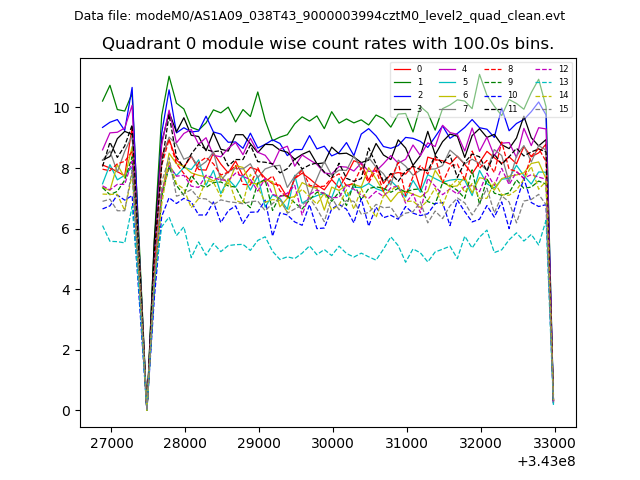
| Module-wise count rates for Quadrant A Data is divided into 100 sec bins |
 |
 |
| Module-wise count rates for Quadrant B Data is divided into 100 sec bins |
 |
 |
| Module-wise count rates for Quadrant C Data is divided into 100 sec bins |
 |
 |
| Module-wise count rates for Quadrant D Data is divided into 100 sec bins |
 |
 |
| Parameter | Plot |
|---|---|
| CZT HV Monitor |  |
| D_VDD |  |
| Temperature 1 |  |
| Veto HV Monitor |  |
| Veto LLD |  |
| Alpha Counter | 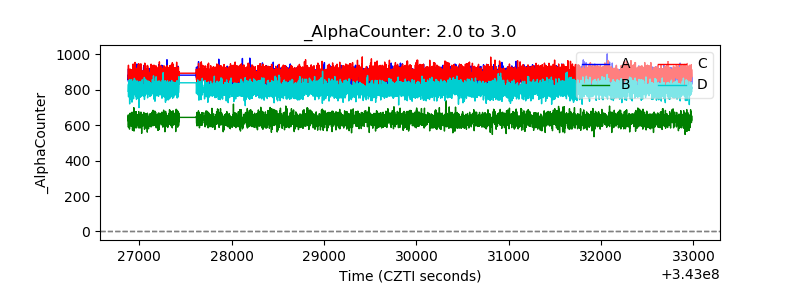 |
| _CPM_Rate |  |
| CZT Counter |  |
| +2.5 Volts monitor | 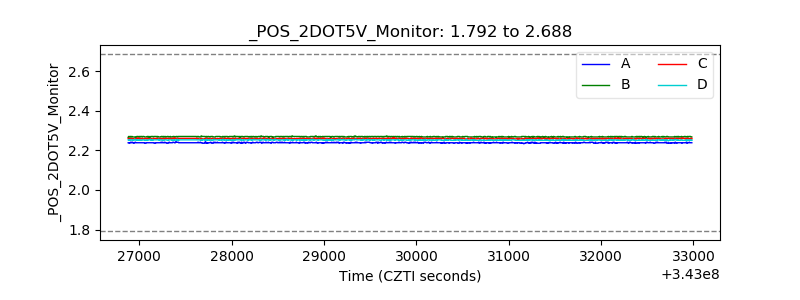 |
| +5 Volts monitor |  |
| _ROLL_ROT |  |
| _Roll_DEC |  |
| _Roll_RA |  |
| Veto Counter | 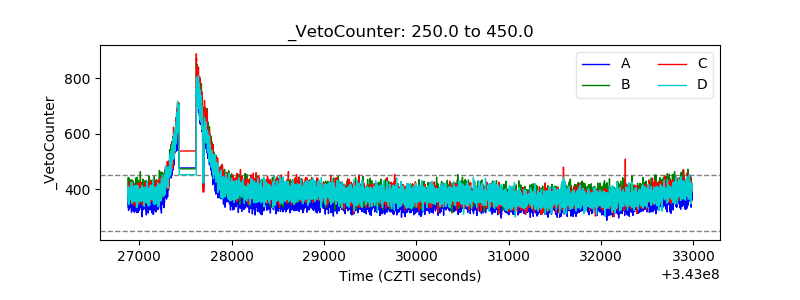 |