| Param | Original file | Final file |
|---|---|---|
| Filename | modeM0/AS1T03_263T01_9000003990cztM0_level2_bc.evt | modeM0/AS1T03_263T01_9000003990cztM0_level2_quad_clean.evt |
| Size (bytes) | 4,123,301,760 | 1,657,200,960 |
| Size | 3.8 GB | 1.5 GB |
| Events in quadrant A | 30,603,601 | 11,205,445 |
| Events in quadrant B | 27,618,391 | 11,278,788 |
| Events in quadrant C | 27,445,699 | 10,907,057 |
| Events in quadrant D | 32,742,999 | 10,294,941 |
| Mode SS | |||
|---|---|---|---|
| Quadrant | BADHDUFLAG | Total packets | Discarded packets |
| A | 0 | 1938 | 0 |
| B | 0 | 1938 | 0 |
| C | 0 | 1938 | 0 |
| D | 0 | 1938 | 0 |
| Mode M0 | |||
|---|---|---|---|
| Quadrant | BADHDUFLAG | Total packets | Discarded packets |
| A | 0 | 229300 | 0 |
| B | 0 | 224323 | 0 |
| C | 0 | 226107 | 0 |
| D | 0 | 238852 | 0 |
| Mode M9 | |||
|---|---|---|---|
| Quadrant | BADHDUFLAG | Total packets | Discarded packets |
| A | 0 | 165 | 0 |
| B | 0 | 165 | 0 |
| C | 0 | 165 | 0 |
| D | 0 | 165 | 0 |
| Quadrant | Total seconds | Saturated seconds | Saturation percentage |
|---|---|---|---|
| A | 95044 | 1503 | 1.581373% |
| B | 95044 | 3339 | 3.513110% |
| C | 95044 | 2433 | 2.559867% |
| D | 95044 | 3026 | 3.183789% |
Noise dominated data is calculated using 1-second bins in cleaned event files. If a bin has >2000 counts, and if more than 50% of those come from <1% of pixels, then it is considered to be noise-dominated and hence unusable.
| Quadrant | # 1 sec bins | Bins with >0 counts | Bins with >2000 counts | High rate bins dominated by noise | Noise dominated (total time) | Noise dominated (detector-on time) | Marked lightcurve |
|---|---|---|---|---|---|---|---|
| A | 111570 | 95033 | 107 | 107 | 0.10% | 0.11% |  |
| B | 111570 | 95029 | 50 | 50 | 0.04% | 0.05% |  |
| C | 111570 | 95030 | 8 | 8 | 0.01% | 0.01% | 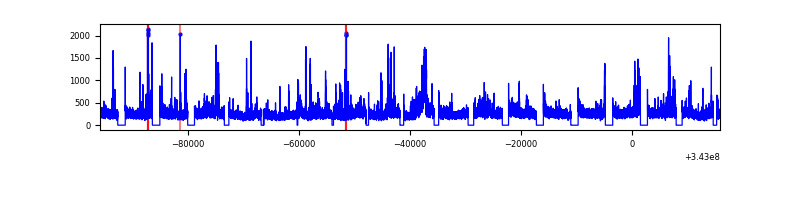 |
| D | 111570 | 95032 | 257 | 257 | 0.23% | 0.27% |  |
Top three noisy pixels from each quadrant. If the there are fewer than three noisy pixels in the level2.evt file, extra rows are filled as -1
| Pixel properties | Quadrant properties | ||||||
|---|---|---|---|---|---|---|---|
| Quadrant | DetID | PixID | Counts | Sigma | Mean | Median | Sigma |
| A | 6 | 16 | 6181244 | 3839.59 | 6072 | 5787 | 1608.4 |
| A | 0 | 13 | 899447 | 555.63 | 6072 | 5787 | 1608.4 |
| A | 13 | 254 | 145188 | 86.67 | 6072 | 5787 | 1608.4 |
| B | 3 | 64 | 3320549 | 2311.02 | 6118 | 5923 | 1434.3 |
| B | 5 | 255 | 221448 | 150.27 | 6118 | 5923 | 1434.3 |
| B | 0 | 230 | 160800 | 107.98 | 6118 | 5923 | 1434.3 |
| C | 3 | 233 | 4434473 | 2706.69 | 5884 | 5825 | 1636.2 |
| C | 0 | 207 | 277742 | 166.19 | 5884 | 5825 | 1636.2 |
| C | 10 | 22 | 72883 | 40.98 | 5884 | 5825 | 1636.2 |
| D | 1 | 52 | 6411682 | 4013.51 | 5827 | 5496 | 1596.2 |
| D | 11 | 176 | 2490102 | 1556.62 | 5827 | 5496 | 1596.2 |
| D | 2 | 250 | 927295 | 577.51 | 5827 | 5496 | 1596.2 |
Histogram calculated using DETX and DETY for each event in the final _common_clean file
| Quadrant A |  |
 |
Quadrant B |
|---|---|---|---|
| Quadrant D | 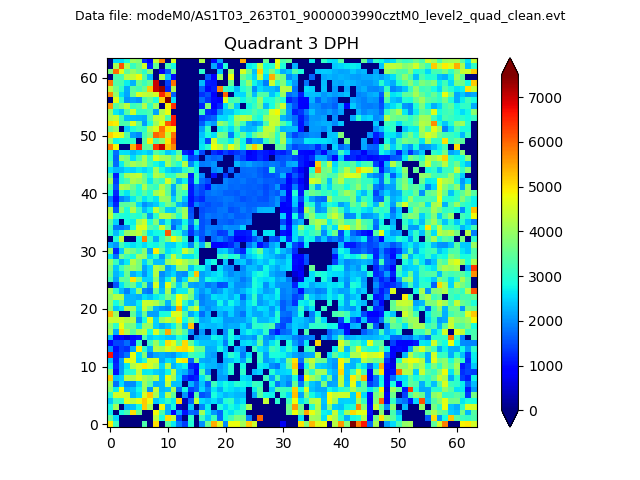 |
 |
Quadrant C |
| Plot type | Count rate plots | Images |
|---|---|---|
| Comparison with Poisson distribution Blue bars denote a histogram of data divided into 1 sec bins. Red curve is a Poisson curve with rate = median count rate of data. |
 |
 |
| Quadrant-wise count rates Data is divided into 100 sec bins |
 |
|
| Module-wise count rates for Quadrant A Data is divided into 100 sec bins |
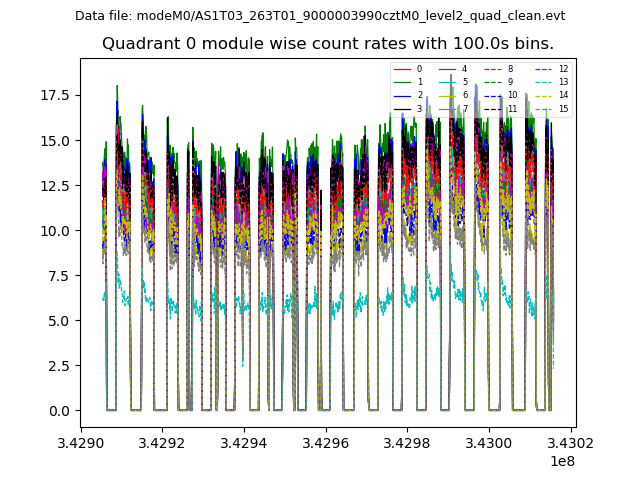 |
 |
| Module-wise count rates for Quadrant B Data is divided into 100 sec bins |
 |
 |
| Module-wise count rates for Quadrant C Data is divided into 100 sec bins |
 |
 |
| Module-wise count rates for Quadrant D Data is divided into 100 sec bins |
 |
 |
| Parameter | Plot |
|---|---|
| CZT HV Monitor |  |
| D_VDD |  |
| Temperature 1 |  |
| Veto HV Monitor |  |
| Veto LLD |  |
| Alpha Counter |  |
| _CPM_Rate |  |
| CZT Counter |  |
| +2.5 Volts monitor |  |
| +5 Volts monitor | 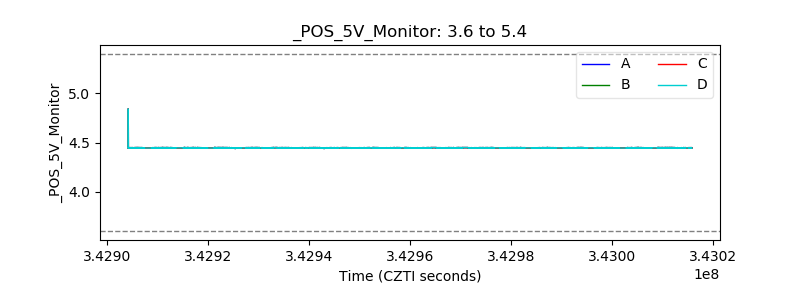 |
| _ROLL_ROT | 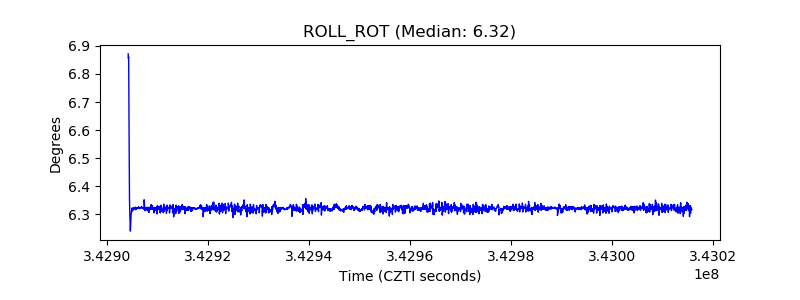 |
| _Roll_DEC |  |
| _Roll_RA | 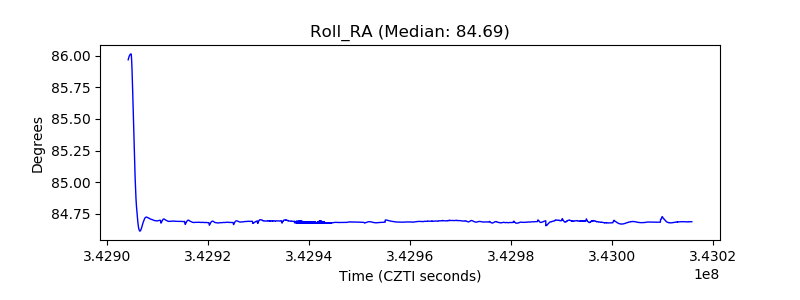 |
| Veto Counter |  |