| Param | Original file | Final file |
|---|---|---|
| Filename | modeM0/AS1A09_038T39_9000003984cztM0_level2_bc.evt | modeM0/AS1A09_038T39_9000003984cztM0_level2_quad_clean.evt |
| Size (bytes) | 188,164,800 | 78,960,960 |
| Size | 179.4 MB | 75.3 MB |
| Events in quadrant A | 883,878 | 544,176 |
| Events in quadrant B | 1,037,484 | 548,113 |
| Events in quadrant C | 824,584 | 517,676 |
| Events in quadrant D | 2,661,929 | 488,300 |
| Mode M9 | |||
|---|---|---|---|
| Quadrant | BADHDUFLAG | Total packets | Discarded packets |
| A | 0 | 9 | 0 |
| B | 0 | 9 | 0 |
| C | 0 | 9 | 0 |
| D | 0 | 9 | 0 |
| Mode M0 | |||
|---|---|---|---|
| Quadrant | BADHDUFLAG | Total packets | Discarded packets |
| A | 0 | 8700 | 0 |
| B | 0 | 9336 | 0 |
| C | 0 | 8589 | 0 |
| D | 0 | 14367 | 0 |
| Mode SS | |||
|---|---|---|---|
| Quadrant | BADHDUFLAG | Total packets | Discarded packets |
| A | 0 | 84 | 0 |
| B | 0 | 84 | 0 |
| C | 0 | 84 | 0 |
| D | 0 | 84 | 0 |
| Quadrant | Total seconds | Saturated seconds | Saturation percentage |
|---|---|---|---|
| A | 4162 | 27 | 0.648727% |
| B | 4162 | 58 | 1.393561% |
| C | 4162 | 32 | 0.768861% |
| D | 4162 | 305 | 7.328208% |
Noise dominated data is calculated using 1-second bins in cleaned event files. If a bin has >2000 counts, and if more than 50% of those come from <1% of pixels, then it is considered to be noise-dominated and hence unusable.
| Quadrant | # 1 sec bins | Bins with >0 counts | Bins with >2000 counts | High rate bins dominated by noise | Noise dominated (total time) | Noise dominated (detector-on time) | Marked lightcurve |
|---|---|---|---|---|---|---|---|
| A | 4160 | 4160 | 0 | 0 | 0.00% | 0.00% |  |
| B | 4161 | 4161 | 0 | 0 | 0.00% | 0.00% |  |
| C | 4161 | 4161 | 1 | 1 | 0.02% | 0.02% |  |
| D | 4161 | 4161 | 41 | 41 | 0.99% | 0.99% |  |
Top three noisy pixels from each quadrant. If the there are fewer than three noisy pixels in the level2.evt file, extra rows are filled as -1
| Pixel properties | Quadrant properties | ||||||
|---|---|---|---|---|---|---|---|
| Quadrant | DetID | PixID | Counts | Sigma | Mean | Median | Sigma |
| A | 13 | 248 | 38212 | 756.82 | 217 | 213 | 50.2 |
| A | 13 | 254 | 7351 | 142.17 | 217 | 213 | 50.2 |
| A | 8 | 192 | 5415 | 103.61 | 217 | 213 | 50.2 |
| B | 5 | 172 | 108749 | 2468.83 | 218 | 213 | 44.0 |
| B | 0 | 230 | 52689 | 1193.65 | 218 | 213 | 44.0 |
| B | 0 | 244 | 8681 | 192.62 | 218 | 213 | 44.0 |
| C | 15 | 208 | 11963 | 228.47 | 206 | 204 | 51.5 |
| C | 8 | 208 | 11060 | 210.92 | 206 | 204 | 51.5 |
| C | 3 | 233 | 8083 | 153.08 | 206 | 204 | 51.5 |
| D | 1 | 52 | 1076951 | 21803.94 | 204 | 197 | 49.4 |
| D | 12 | 2 | 595598 | 12056.69 | 204 | 197 | 49.4 |
| D | 2 | 250 | 128948 | 2607.17 | 204 | 197 | 49.4 |
Histogram calculated using DETX and DETY for each event in the final _common_clean file
| Quadrant A | 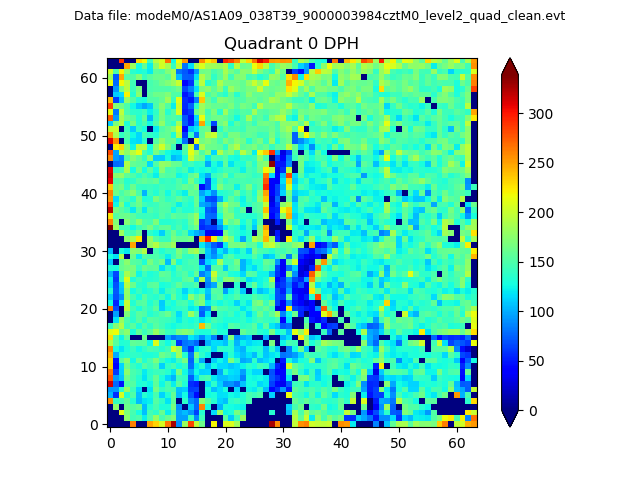 |
 |
Quadrant B |
|---|---|---|---|
| Quadrant D |  |
 |
Quadrant C |
| Plot type | Count rate plots | Images |
|---|---|---|
| Comparison with Poisson distribution Blue bars denote a histogram of data divided into 1 sec bins. Red curve is a Poisson curve with rate = median count rate of data. |
 |
 |
| Quadrant-wise count rates Data is divided into 100 sec bins |
 |
|
| Module-wise count rates for Quadrant A Data is divided into 100 sec bins |
 |
 |
| Module-wise count rates for Quadrant B Data is divided into 100 sec bins |
 |
 |
| Module-wise count rates for Quadrant C Data is divided into 100 sec bins |
 |
 |
| Module-wise count rates for Quadrant D Data is divided into 100 sec bins |
 |
 |
| Parameter | Plot |
|---|---|
| CZT HV Monitor |  |
| D_VDD |  |
| Temperature 1 |  |
| Veto HV Monitor |  |
| Veto LLD |  |
| Alpha Counter | 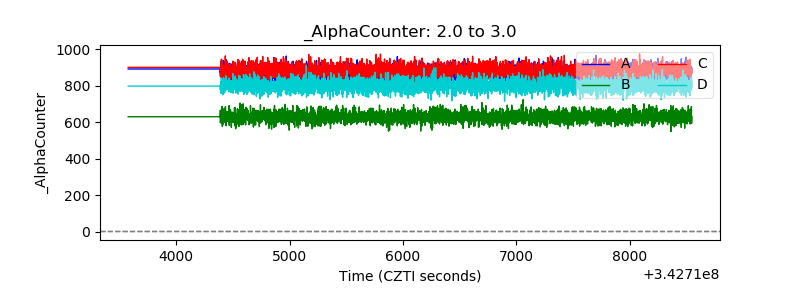 |
| _CPM_Rate | 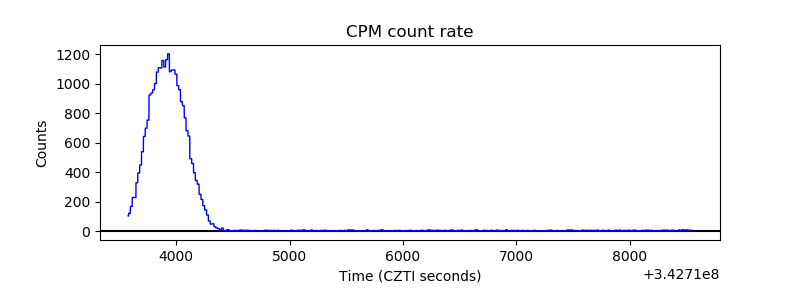 |
| CZT Counter |  |
| +2.5 Volts monitor |  |
| +5 Volts monitor | 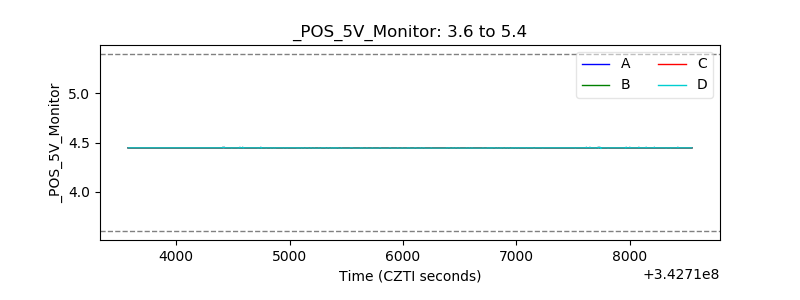 |
| _ROLL_ROT |  |
| _Roll_DEC |  |
| _Roll_RA |  |
| Veto Counter |  |