| Param | Original file | Final file |
|---|---|---|
| Filename | modeM0/AS1A09_038T38_9000003982cztM0_level2_bc.evt | modeM0/AS1A09_038T38_9000003982cztM0_level2_quad_clean.evt |
| Size (bytes) | 246,211,200 | 96,958,080 |
| Size | 234.8 MB | 92.5 MB |
| Events in quadrant A | 1,150,543 | 664,234 |
| Events in quadrant B | 1,092,360 | 675,282 |
| Events in quadrant C | 990,637 | 638,603 |
| Events in quadrant D | 3,857,363 | 589,870 |
| Mode SS | |||
|---|---|---|---|
| Quadrant | BADHDUFLAG | Total packets | Discarded packets |
| A | 0 | 106 | 0 |
| B | 0 | 106 | 0 |
| C | 0 | 106 | 0 |
| D | 0 | 106 | 0 |
| Mode M0 | |||
|---|---|---|---|
| Quadrant | BADHDUFLAG | Total packets | Discarded packets |
| A | 0 | 11153 | 0 |
| B | 0 | 10808 | 0 |
| C | 0 | 10719 | 0 |
| D | 0 | 20202 | 0 |
| Mode M9 | |||
|---|---|---|---|
| Quadrant | BADHDUFLAG | Total packets | Discarded packets |
| A | 0 | 8 | 0 |
| B | 0 | 8 | 0 |
| C | 0 | 8 | 0 |
| D | 0 | 8 | 0 |
| Quadrant | Total seconds | Saturated seconds | Saturation percentage |
|---|---|---|---|
| A | 5261 | 98 | 1.862764% |
| B | 5261 | 71 | 1.349553% |
| C | 5261 | 91 | 1.729709% |
| D | 5261 | 769 | 14.616993% |
Noise dominated data is calculated using 1-second bins in cleaned event files. If a bin has >2000 counts, and if more than 50% of those come from <1% of pixels, then it is considered to be noise-dominated and hence unusable.
| Quadrant | # 1 sec bins | Bins with >0 counts | Bins with >2000 counts | High rate bins dominated by noise | Noise dominated (total time) | Noise dominated (detector-on time) | Marked lightcurve |
|---|---|---|---|---|---|---|---|
| A | 5981 | 5260 | 4 | 4 | 0.07% | 0.08% |  |
| B | 5981 | 5260 | 0 | 0 | 0.00% | 0.00% | 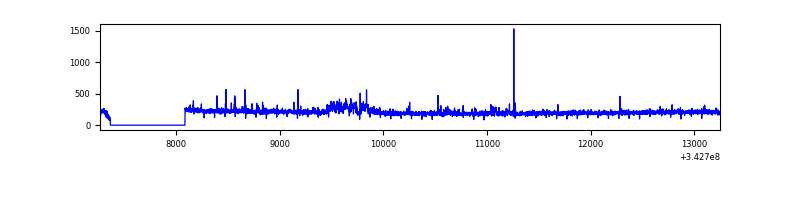 |
| C | 5981 | 5260 | 0 | 0 | 0.00% | 0.00% |  |
| D | 5981 | 5260 | 303 | 303 | 5.07% | 5.76% | 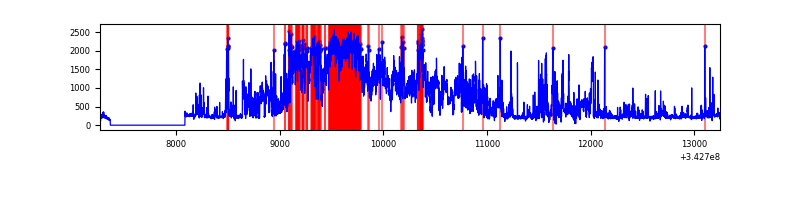 |
Top three noisy pixels from each quadrant. If the there are fewer than three noisy pixels in the level2.evt file, extra rows are filled as -1
| Pixel properties | Quadrant properties | ||||||
|---|---|---|---|---|---|---|---|
| Quadrant | DetID | PixID | Counts | Sigma | Mean | Median | Sigma |
| A | 13 | 248 | 112487 | 1851.26 | 266 | 261 | 60.6 |
| A | 13 | 254 | 8770 | 140.36 | 266 | 261 | 60.6 |
| A | 8 | 192 | 5397 | 84.72 | 266 | 261 | 60.6 |
| B | 0 | 230 | 44423 | 803.41 | 268 | 262 | 55.0 |
| B | 0 | 190 | 4638 | 79.61 | 268 | 262 | 55.0 |
| B | 15 | 32 | 3984 | 67.71 | 268 | 262 | 55.0 |
| C | 3 | 233 | 7308 | 112.38 | 254 | 252 | 62.8 |
| C | 8 | 208 | 3193 | 46.84 | 254 | 252 | 62.8 |
| C | 13 | 61 | 1456 | 19.18 | 254 | 252 | 62.8 |
| D | 1 | 52 | 1160998 | 18947.72 | 248 | 238 | 61.3 |
| D | 12 | 2 | 1063259 | 17352.27 | 248 | 238 | 61.3 |
| D | 6 | 112 | 517304 | 8440.35 | 248 | 238 | 61.3 |
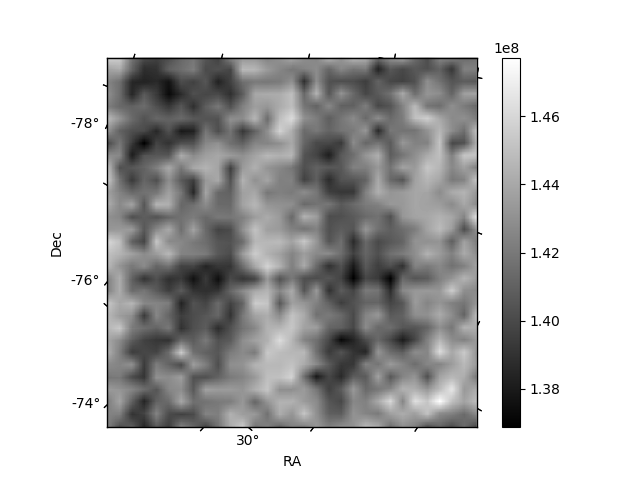
Histogram calculated using DETX and DETY for each event in the final _common_clean file
| Quadrant A |  |
 |
Quadrant B |
|---|---|---|---|
| Quadrant D |  |
 |
Quadrant C |
| Plot type | Count rate plots | Images |
|---|---|---|
| Comparison with Poisson distribution Blue bars denote a histogram of data divided into 1 sec bins. Red curve is a Poisson curve with rate = median count rate of data. |
 |
 |
| Quadrant-wise count rates Data is divided into 100 sec bins |
 |
|
| Module-wise count rates for Quadrant A Data is divided into 100 sec bins |
 |
 |
| Module-wise count rates for Quadrant B Data is divided into 100 sec bins |
 |
 |
| Module-wise count rates for Quadrant C Data is divided into 100 sec bins |
 |
 |
| Module-wise count rates for Quadrant D Data is divided into 100 sec bins |
 |
 |
| Parameter | Plot |
|---|---|
| CZT HV Monitor |  |
| D_VDD |  |
| Temperature 1 |  |
| Veto HV Monitor |  |
| Veto LLD |  |
| Alpha Counter |  |
| _CPM_Rate |  |
| CZT Counter |  |
| +2.5 Volts monitor | 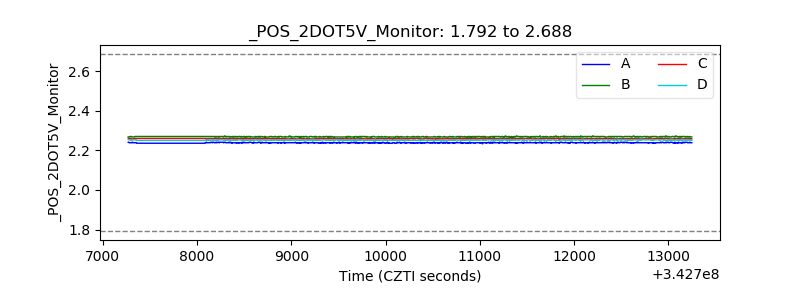 |
| +5 Volts monitor |  |
| _ROLL_ROT |  |
| _Roll_DEC | 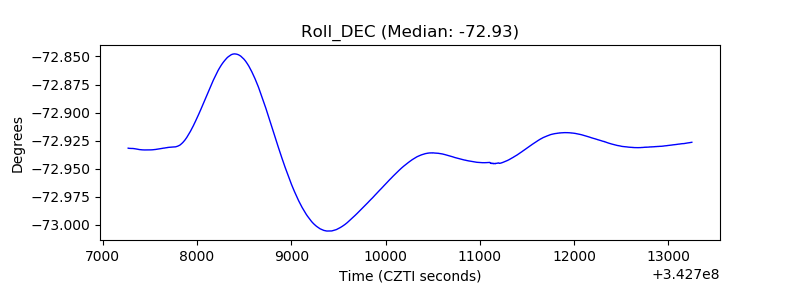 |
| _Roll_RA |  |
| Veto Counter |  |