| Param | Original file | Final file |
|---|---|---|
| Filename | modeM0/AS1A09_038T37_9000003980cztM0_level2_bc.evt | modeM0/AS1A09_038T37_9000003980cztM0_level2_quad_clean.evt |
| Size (bytes) | 213,255,360 | 91,258,560 |
| Size | 203.4 MB | 87.0 MB |
| Events in quadrant A | 970,333 | 618,479 |
| Events in quadrant B | 1,047,295 | 628,469 |
| Events in quadrant C | 1,185,217 | 595,572 |
| Events in quadrant D | 2,908,694 | 571,796 |
| Mode M0 | |||
|---|---|---|---|
| Quadrant | BADHDUFLAG | Total packets | Discarded packets |
| A | 0 | 10030 | 0 |
| B | 0 | 10156 | 0 |
| C | 0 | 10770 | 0 |
| D | 0 | 16030 | 0 |
| Mode SS | |||
|---|---|---|---|
| Quadrant | BADHDUFLAG | Total packets | Discarded packets |
| A | 0 | 100 | 0 |
| B | 0 | 100 | 0 |
| C | 0 | 100 | 0 |
| D | 0 | 100 | 0 |
| Quadrant | Total seconds | Saturated seconds | Saturation percentage |
|---|---|---|---|
| A | 4981 | 4 | 0.080305% |
| B | 4981 | 8 | 0.160610% |
| C | 4981 | 72 | 1.445493% |
| D | 4981 | 323 | 6.484642% |
Noise dominated data is calculated using 1-second bins in cleaned event files. If a bin has >2000 counts, and if more than 50% of those come from <1% of pixels, then it is considered to be noise-dominated and hence unusable.
| Quadrant | # 1 sec bins | Bins with >0 counts | Bins with >2000 counts | High rate bins dominated by noise | Noise dominated (total time) | Noise dominated (detector-on time) | Marked lightcurve |
|---|---|---|---|---|---|---|---|
| A | 4981 | 4981 | 0 | 0 | 0.00% | 0.00% |  |
| B | 4981 | 4981 | 1 | 1 | 0.02% | 0.02% |  |
| C | 4981 | 4981 | 5 | 5 | 0.10% | 0.10% |  |
| D | 4981 | 4981 | 143 | 143 | 2.87% | 2.87% |  |
Top three noisy pixels from each quadrant. If the there are fewer than three noisy pixels in the level2.evt file, extra rows are filled as -1
| Pixel properties | Quadrant properties | ||||||
|---|---|---|---|---|---|---|---|
| Quadrant | DetID | PixID | Counts | Sigma | Mean | Median | Sigma |
| A | 13 | 248 | 8986 | 152.64 | 247 | 242 | 57.3 |
| A | 13 | 254 | 8212 | 139.13 | 247 | 242 | 57.3 |
| A | 0 | 226 | 1558 | 22.97 | 247 | 242 | 57.3 |
| B | 0 | 230 | 30054 | 582.27 | 250 | 244 | 51.2 |
| B | 5 | 172 | 30018 | 581.56 | 250 | 244 | 51.2 |
| B | 0 | 190 | 7273 | 137.29 | 250 | 244 | 51.2 |
| C | 8 | 208 | 240092 | 4092.25 | 236 | 234 | 58.6 |
| C | 3 | 233 | 27335 | 462.37 | 236 | 234 | 58.6 |
| C | 4 | 224 | 5522 | 90.22 | 236 | 234 | 58.6 |
| D | 12 | 2 | 1431649 | 24384.24 | 239 | 229 | 58.7 |
| D | 1 | 52 | 350529 | 5967.36 | 239 | 229 | 58.7 |
| D | 7 | 80 | 77383 | 1314.32 | 239 | 229 | 58.7 |
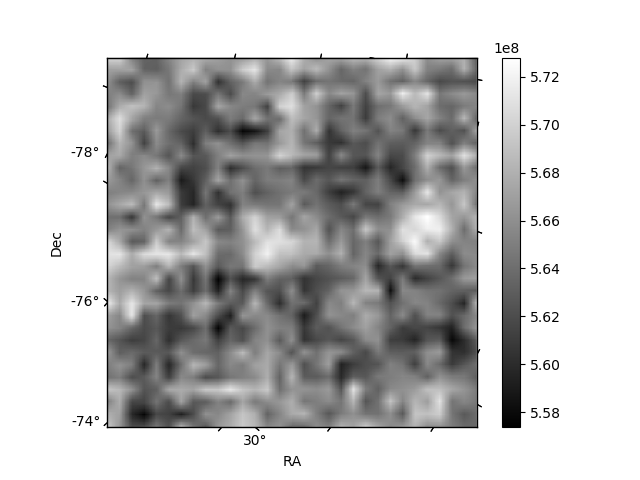
Histogram calculated using DETX and DETY for each event in the final _common_clean file
| Quadrant A |  |
 |
Quadrant B |
|---|---|---|---|
| Quadrant D |  |
 |
Quadrant C |
| Plot type | Count rate plots | Images |
|---|---|---|
| Comparison with Poisson distribution Blue bars denote a histogram of data divided into 1 sec bins. Red curve is a Poisson curve with rate = median count rate of data. |
 |
 |
| Quadrant-wise count rates Data is divided into 100 sec bins |
 |
|
| Module-wise count rates for Quadrant A Data is divided into 100 sec bins |
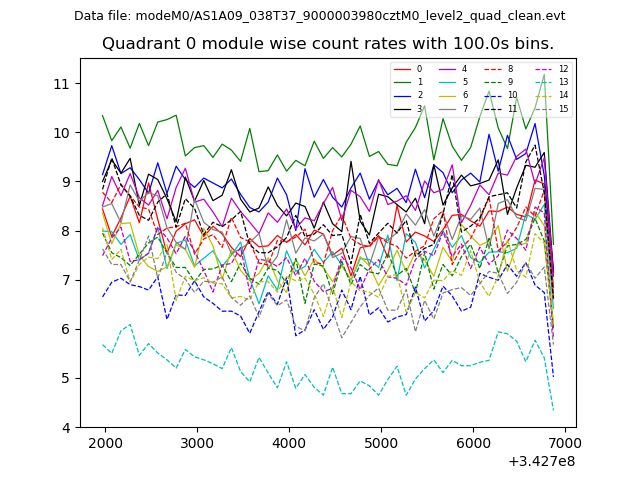 |
 |
| Module-wise count rates for Quadrant B Data is divided into 100 sec bins |
 |
 |
| Module-wise count rates for Quadrant C Data is divided into 100 sec bins |
 |
 |
| Module-wise count rates for Quadrant D Data is divided into 100 sec bins |
 |
 |
| Parameter | Plot |
|---|---|
| CZT HV Monitor |  |
| D_VDD |  |
| Temperature 1 |  |
| Veto HV Monitor |  |
| Veto LLD | 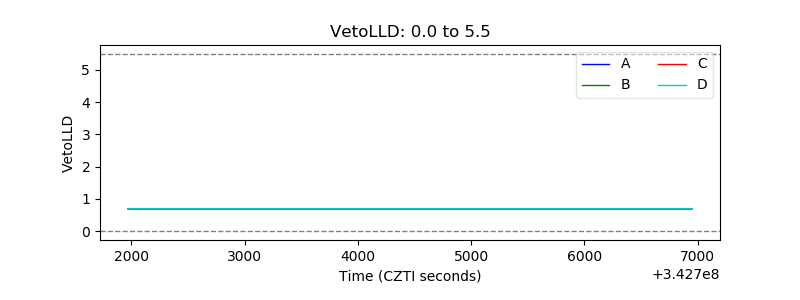 |
| Alpha Counter |  |
| _CPM_Rate |  |
| CZT Counter | 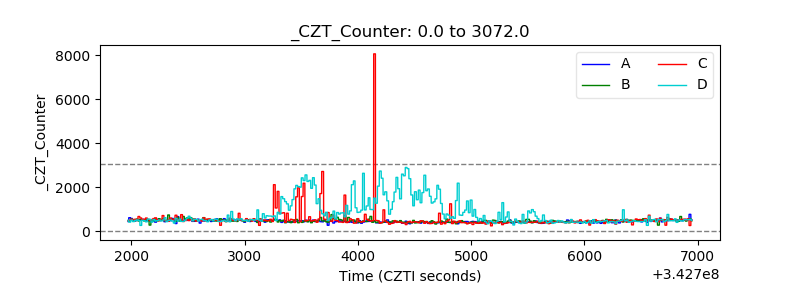 |
| +2.5 Volts monitor |  |
| +5 Volts monitor |  |
| _ROLL_ROT |  |
| _Roll_DEC |  |
| _Roll_RA |  |
| Veto Counter |  |