| Param | Original file | Final file |
|---|---|---|
| Filename | modeM0/AS1A09_038T36_9000003978cztM0_level2_bc.evt | modeM0/AS1A09_038T36_9000003978cztM0_level2_quad_clean.evt |
| Size (bytes) | 233,717,760 | 100,998,720 |
| Size | 222.9 MB | 96.3 MB |
| Events in quadrant A | 1,266,397 | 663,708 |
| Events in quadrant B | 1,316,968 | 675,418 |
| Events in quadrant C | 1,397,118 | 644,186 |
| Events in quadrant D | 2,648,951 | 624,203 |
| Mode SS | |||
|---|---|---|---|
| Quadrant | BADHDUFLAG | Total packets | Discarded packets |
| A | 0 | 134 | 0 |
| B | 0 | 134 | 0 |
| C | 0 | 134 | 0 |
| D | 0 | 134 | 0 |
| Mode M0 | |||
|---|---|---|---|
| Quadrant | BADHDUFLAG | Total packets | Discarded packets |
| A | 0 | 13322 | 0 |
| B | 0 | 13424 | 0 |
| C | 0 | 13761 | 0 |
| D | 0 | 17477 | 0 |
| Mode M9 | |||
|---|---|---|---|
| Quadrant | BADHDUFLAG | Total packets | Discarded packets |
| A | 0 | 7 | 0 |
| B | 0 | 7 | 0 |
| C | 0 | 7 | 0 |
| D | 0 | 7 | 0 |
| Quadrant | Total seconds | Saturated seconds | Saturation percentage |
|---|---|---|---|
| A | 6467 | 192 | 2.968919% |
| B | 6467 | 210 | 3.247255% |
| C | 6467 | 260 | 4.020411% |
| D | 6467 | 296 | 4.577084% |
Noise dominated data is calculated using 1-second bins in cleaned event files. If a bin has >2000 counts, and if more than 50% of those come from <1% of pixels, then it is considered to be noise-dominated and hence unusable.
| Quadrant | # 1 sec bins | Bins with >0 counts | Bins with >2000 counts | High rate bins dominated by noise | Noise dominated (total time) | Noise dominated (detector-on time) | Marked lightcurve |
|---|---|---|---|---|---|---|---|
| A | 6766 | 6465 | 0 | 0 | 0.00% | 0.00% |  |
| B | 6766 | 6465 | 0 | 0 | 0.00% | 0.00% | 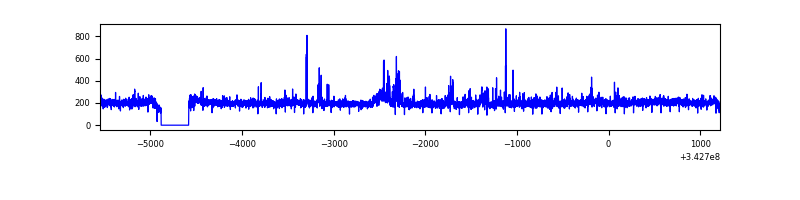 |
| C | 6766 | 6465 | 8 | 8 | 0.12% | 0.12% |  |
| D | 6766 | 6465 | 39 | 39 | 0.58% | 0.60% |  |
Top three noisy pixels from each quadrant. If the there are fewer than three noisy pixels in the level2.evt file, extra rows are filled as -1
| Pixel properties | Quadrant properties | ||||||
|---|---|---|---|---|---|---|---|
| Quadrant | DetID | PixID | Counts | Sigma | Mean | Median | Sigma |
| A | 13 | 254 | 9553 | 125.66 | 324 | 316 | 73.5 |
| A | 13 | 248 | 4246 | 53.46 | 324 | 316 | 73.5 |
| A | 8 | 192 | 3970 | 49.71 | 324 | 316 | 73.5 |
| B | 0 | 230 | 27581 | 418.87 | 327 | 318 | 65.1 |
| B | 15 | 32 | 17654 | 266.35 | 327 | 318 | 65.1 |
| B | 15 | 33 | 9787 | 145.48 | 327 | 318 | 65.1 |
| C | 8 | 208 | 147246 | 1938.41 | 311 | 308 | 75.8 |
| C | 3 | 233 | 30297 | 395.62 | 311 | 308 | 75.8 |
| C | 10 | 22 | 12420 | 159.78 | 311 | 308 | 75.8 |
| D | 12 | 2 | 762178 | 10282.95 | 316 | 304 | 74.1 |
| D | 1 | 52 | 439258 | 5924.53 | 316 | 304 | 74.1 |
| D | 2 | 250 | 177766 | 2395.19 | 316 | 304 | 74.1 |
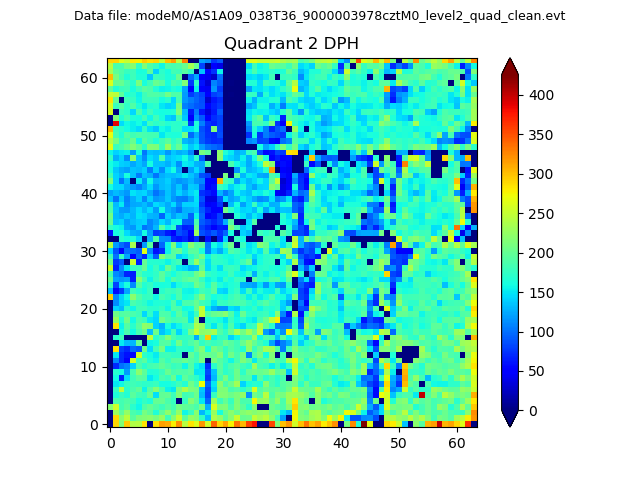
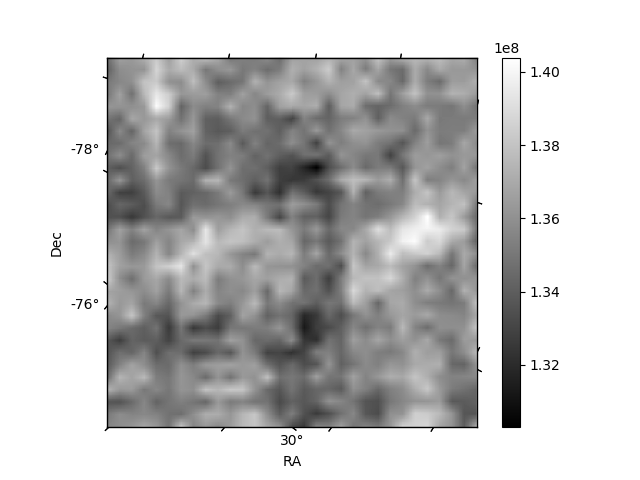
Histogram calculated using DETX and DETY for each event in the final _common_clean file
| Quadrant A |  |
 |
Quadrant B |
|---|---|---|---|
| Quadrant D |  |
 |
Quadrant C |
| Plot type | Count rate plots | Images |
|---|---|---|
| Comparison with Poisson distribution Blue bars denote a histogram of data divided into 1 sec bins. Red curve is a Poisson curve with rate = median count rate of data. |
 |
 |
| Quadrant-wise count rates Data is divided into 100 sec bins |
 |
|
| Module-wise count rates for Quadrant A Data is divided into 100 sec bins |
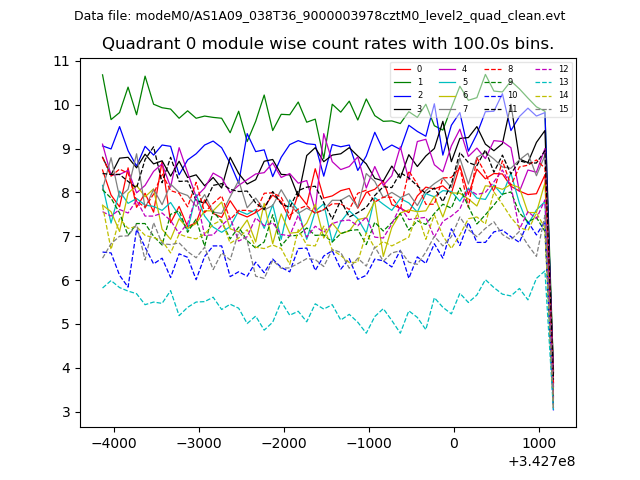 |
 |
| Module-wise count rates for Quadrant B Data is divided into 100 sec bins |
 |
 |
| Module-wise count rates for Quadrant C Data is divided into 100 sec bins |
 |
 |
| Module-wise count rates for Quadrant D Data is divided into 100 sec bins |
 |
 |
| Parameter | Plot |
|---|---|
| CZT HV Monitor | 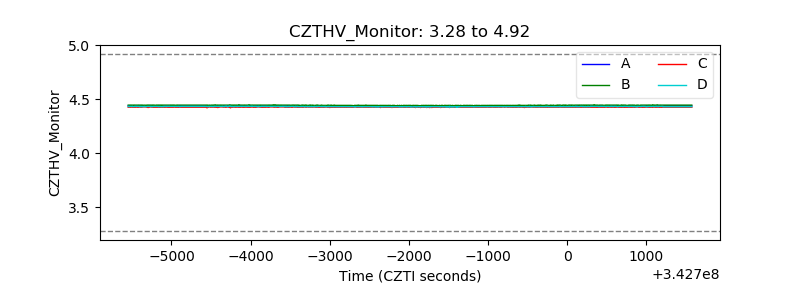 |
| D_VDD | 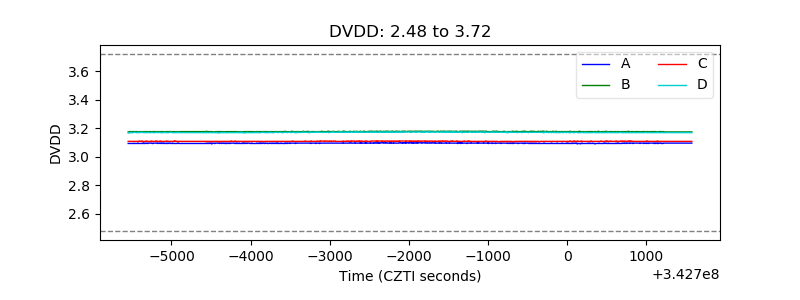 |
| Temperature 1 |  |
| Veto HV Monitor | 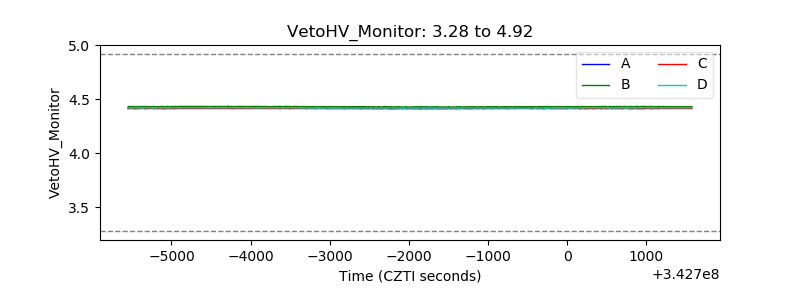 |
| Veto LLD |  |
| Alpha Counter |  |
| _CPM_Rate |  |
| CZT Counter |  |
| +2.5 Volts monitor |  |
| +5 Volts monitor |  |
| _ROLL_ROT | 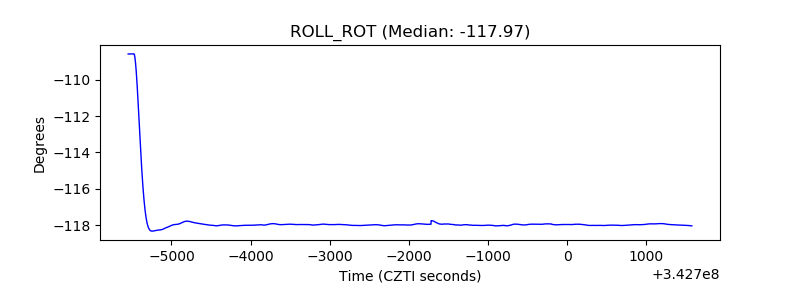 |
| _Roll_DEC | 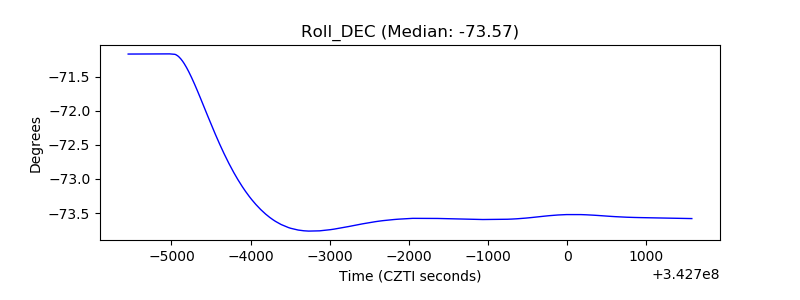 |
| _Roll_RA |  |
| Veto Counter |  |