| Param | Original file | Final file |
|---|---|---|
| Filename | modeM0/AS1T03_259T01_9000003972cztM0_level2_bc.evt | modeM0/AS1T03_259T01_9000003972cztM0_level2_quad_clean.evt |
| Size (bytes) | 1,457,982,720 | 436,127,040 |
| Size | 1.4 GB | 415.9 MB |
| Events in quadrant A | 7,249,407 | 2,843,310 |
| Events in quadrant B | 8,181,432 | 2,887,002 |
| Events in quadrant C | 7,210,932 | 2,775,464 |
| Events in quadrant D | 19,194,106 | 2,370,818 |
| Mode M9 | |||
|---|---|---|---|
| Quadrant | BADHDUFLAG | Total packets | Discarded packets |
| A | 0 | 40 | 0 |
| B | 0 | 40 | 0 |
| C | 0 | 40 | 0 |
| D | 0 | 40 | 0 |
| Mode SS | |||
|---|---|---|---|
| Quadrant | BADHDUFLAG | Total packets | Discarded packets |
| A | 0 | 692 | 0 |
| B | 0 | 692 | 0 |
| C | 0 | 692 | 0 |
| D | 0 | 692 | 0 |
| Mode M0 | |||
|---|---|---|---|
| Quadrant | BADHDUFLAG | Total packets | Discarded packets |
| A | 0 | 70584 | 0 |
| B | 0 | 74196 | 0 |
| C | 0 | 71302 | 0 |
| D | 0 | 128291 | 0 |
| Quadrant | Total seconds | Saturated seconds | Saturation percentage |
|---|---|---|---|
| A | 33930 | 667 | 1.965812% |
| B | 33930 | 915 | 2.696729% |
| C | 33930 | 863 | 2.543472% |
| D | 33930 | 6946 | 20.471559% |
Noise dominated data is calculated using 1-second bins in cleaned event files. If a bin has >2000 counts, and if more than 50% of those come from <1% of pixels, then it is considered to be noise-dominated and hence unusable.
| Quadrant | # 1 sec bins | Bins with >0 counts | Bins with >2000 counts | High rate bins dominated by noise | Noise dominated (total time) | Noise dominated (detector-on time) | Marked lightcurve |
|---|---|---|---|---|---|---|---|
| A | 38085 | 33933 | 31 | 31 | 0.08% | 0.09% | 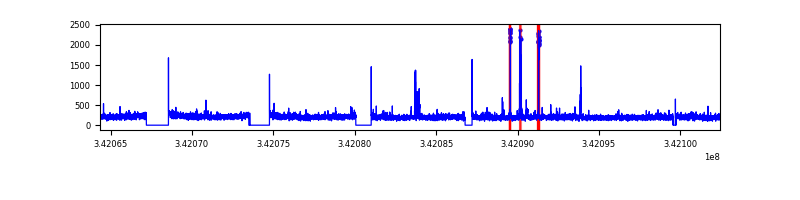 |
| B | 38085 | 33931 | 2 | 2 | 0.01% | 0.01% |  |
| C | 38085 | 33932 | 3 | 3 | 0.01% | 0.01% |  |
| D | 38085 | 33933 | 797 | 797 | 2.09% | 2.35% |  |
Top three noisy pixels from each quadrant. If the there are fewer than three noisy pixels in the level2.evt file, extra rows are filled as -1
| Pixel properties | Quadrant properties | ||||||
|---|---|---|---|---|---|---|---|
| Quadrant | DetID | PixID | Counts | Sigma | Mean | Median | Sigma |
| A | 15 | 169 | 174574 | 439.73 | 1819 | 1787 | 392.9 |
| A | 13 | 254 | 55837 | 137.55 | 1819 | 1787 | 392.9 |
| A | 8 | 192 | 28103 | 66.97 | 1819 | 1787 | 392.9 |
| B | 10 | 245 | 509397 | 1457.28 | 1844 | 1803 | 348.3 |
| B | 3 | 64 | 227125 | 646.89 | 1844 | 1803 | 348.3 |
| B | 4 | 52 | 88157 | 247.92 | 1844 | 1803 | 348.3 |
| C | 2 | 16 | 207557 | 495.69 | 1778 | 1774 | 415.1 |
| C | 14 | 67 | 77446 | 182.28 | 1778 | 1774 | 415.1 |
| C | 10 | 22 | 29230 | 66.14 | 1778 | 1774 | 415.1 |
| D | 7 | 80 | 6869809 | 19463.86 | 1542 | 1494 | 352.9 |
| D | 1 | 52 | 5269203 | 14927.97 | 1542 | 1494 | 352.9 |
| D | 6 | 112 | 489125 | 1381.88 | 1542 | 1494 | 352.9 |
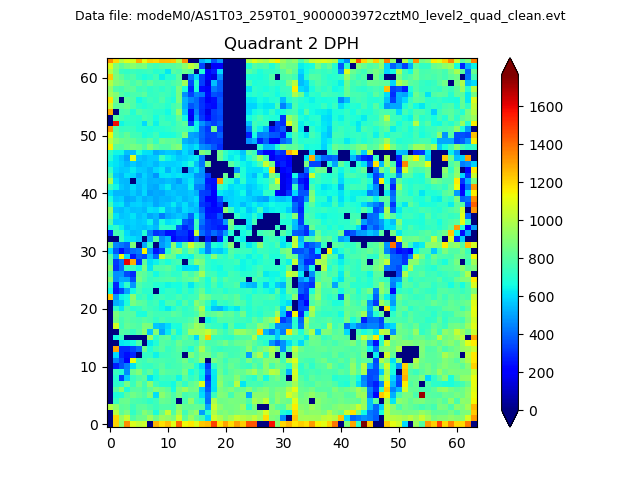
Histogram calculated using DETX and DETY for each event in the final _common_clean file
| Quadrant A | 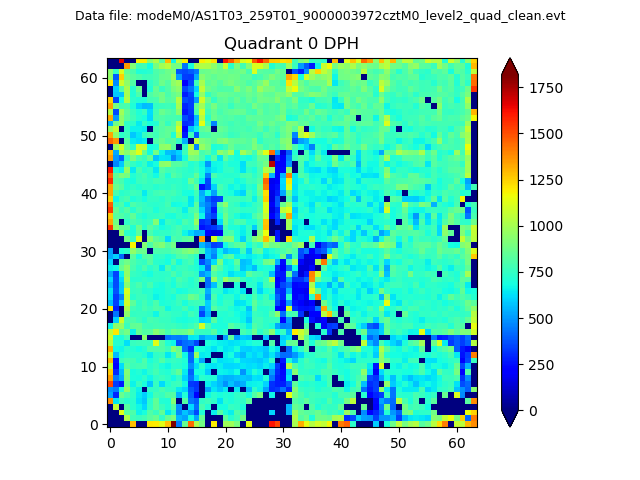 |
 |
Quadrant B |
|---|---|---|---|
| Quadrant D |  |
 |
Quadrant C |
| Plot type | Count rate plots | Images |
|---|---|---|
| Comparison with Poisson distribution Blue bars denote a histogram of data divided into 1 sec bins. Red curve is a Poisson curve with rate = median count rate of data. |
 |
 |
| Quadrant-wise count rates Data is divided into 100 sec bins |
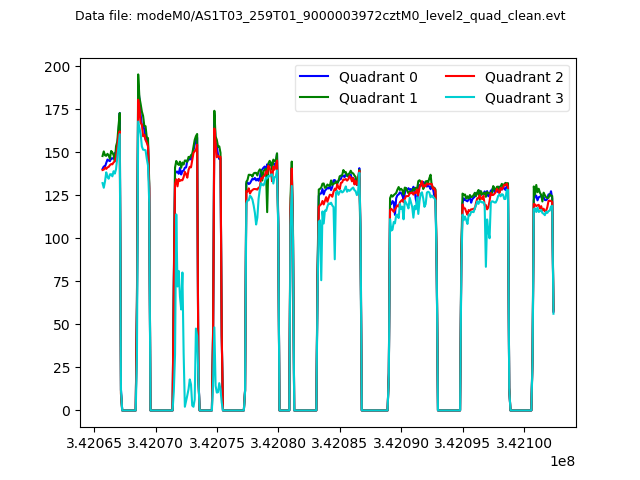 |
|
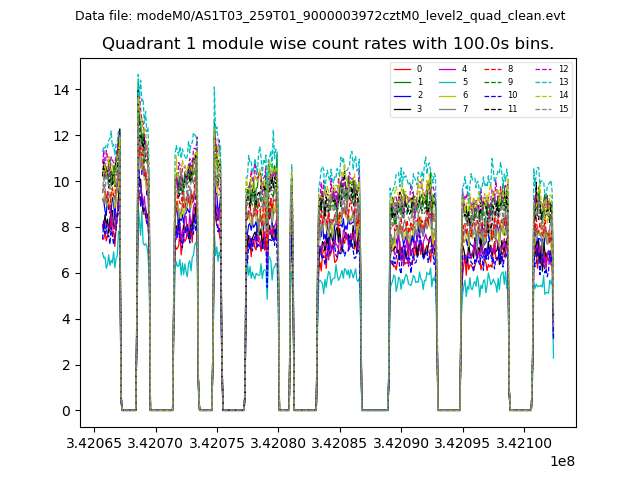
| Module-wise count rates for Quadrant A Data is divided into 100 sec bins |
 |
 |
| Module-wise count rates for Quadrant B Data is divided into 100 sec bins |
 |
 |
| Module-wise count rates for Quadrant C Data is divided into 100 sec bins |
 |
 |
| Module-wise count rates for Quadrant D Data is divided into 100 sec bins |
 |
 |
| Parameter | Plot |
|---|---|
| CZT HV Monitor |  |
| D_VDD | 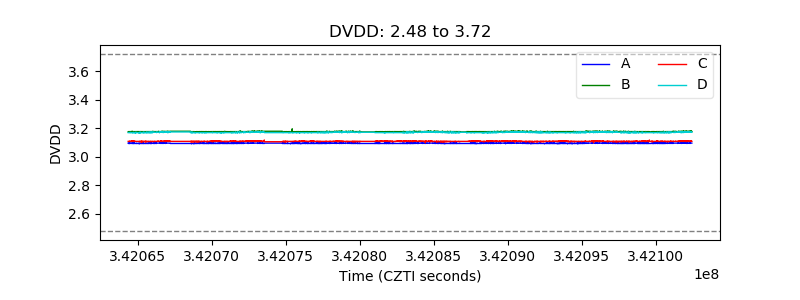 |
| Temperature 1 |  |
| Veto HV Monitor |  |
| Veto LLD | 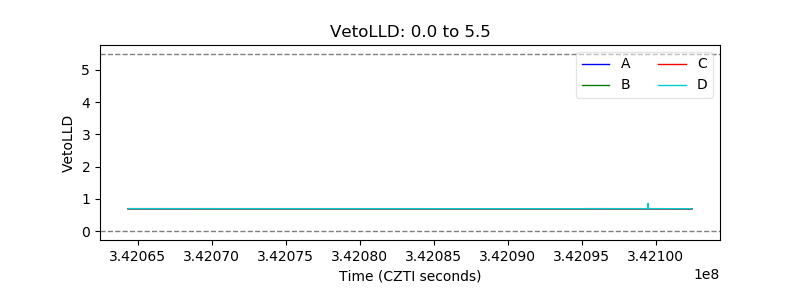 |
| Alpha Counter |  |
| _CPM_Rate |  |
| CZT Counter | 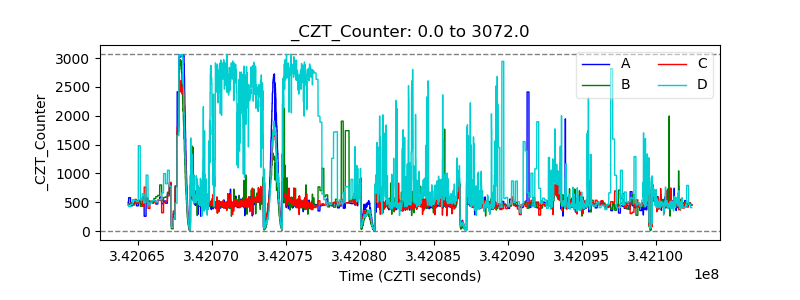 |
| +2.5 Volts monitor |  |
| +5 Volts monitor |  |
| _ROLL_ROT | 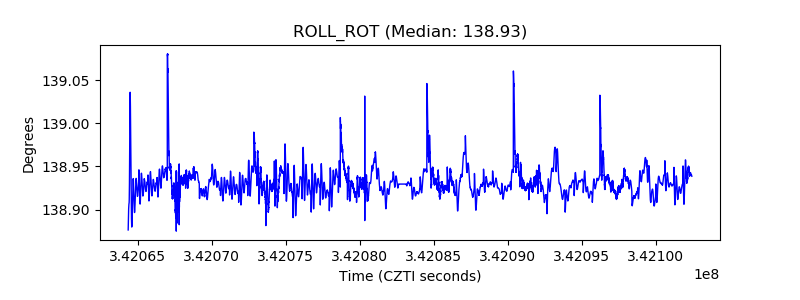 |
| _Roll_DEC |  |
| _Roll_RA |  |
| Veto Counter |  |