| Param | Original file | Final file |
|---|---|---|
| Filename | modeM0/AS1A09_038T33_9000003970cztM0_level2_bc.evt | modeM0/AS1A09_038T33_9000003970cztM0_level2_quad_clean.evt |
| Size (bytes) | 380,989,440 | 153,319,680 |
| Size | 363.3 MB | 146.2 MB |
| Events in quadrant A | 2,040,634 | 1,027,869 |
| Events in quadrant B | 2,196,698 | 1,068,957 |
| Events in quadrant C | 2,071,412 | 1,023,398 |
| Events in quadrant D | 4,632,655 | 922,011 |
| Mode M9 | |||
|---|---|---|---|
| Quadrant | BADHDUFLAG | Total packets | Discarded packets |
| A | 0 | 27 | 0 |
| B | 0 | 27 | 0 |
| C | 0 | 27 | 0 |
| D | 0 | 27 | 0 |
| Mode M0 | |||
|---|---|---|---|
| Quadrant | BADHDUFLAG | Total packets | Discarded packets |
| A | 0 | 18258 | 0 |
| B | 0 | 18915 | 0 |
| C | 0 | 18801 | 0 |
| D | 0 | 28309 | 0 |
| Mode SS | |||
|---|---|---|---|
| Quadrant | BADHDUFLAG | Total packets | Discarded packets |
| A | 0 | 178 | 0 |
| B | 0 | 178 | 0 |
| C | 0 | 178 | 0 |
| D | 0 | 178 | 0 |
| Quadrant | Total seconds | Saturated seconds | Saturation percentage |
|---|---|---|---|
| A | 8663 | 26 | 0.300127% |
| B | 8663 | 48 | 0.554081% |
| C | 8663 | 86 | 0.992728% |
| D | 8663 | 734 | 8.472815% |
Noise dominated data is calculated using 1-second bins in cleaned event files. If a bin has >2000 counts, and if more than 50% of those come from <1% of pixels, then it is considered to be noise-dominated and hence unusable.
| Quadrant | # 1 sec bins | Bins with >0 counts | Bins with >2000 counts | High rate bins dominated by noise | Noise dominated (total time) | Noise dominated (detector-on time) | Marked lightcurve |
|---|---|---|---|---|---|---|---|
| A | 11348 | 8663 | 0 | 0 | 0.00% | 0.00% |  |
| B | 11348 | 8663 | 0 | 0 | 0.00% | 0.00% | 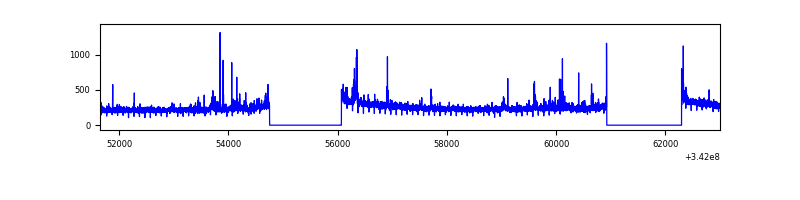 |
| C | 11348 | 8663 | 0 | 0 | 0.00% | 0.00% |  |
| D | 11348 | 8663 | 222 | 222 | 1.96% | 2.56% |  |
Top three noisy pixels from each quadrant. If the there are fewer than three noisy pixels in the level2.evt file, extra rows are filled as -1
| Pixel properties | Quadrant properties | ||||||
|---|---|---|---|---|---|---|---|
| Quadrant | DetID | PixID | Counts | Sigma | Mean | Median | Sigma |
| A | 8 | 192 | 14117 | 120.66 | 524 | 518 | 112.7 |
| A | 13 | 254 | 13821 | 118.04 | 524 | 518 | 112.7 |
| A | 0 | 226 | 3325 | 24.91 | 524 | 518 | 112.7 |
| B | 3 | 64 | 32501 | 315.84 | 540 | 532 | 101.2 |
| B | 0 | 230 | 27692 | 268.33 | 540 | 532 | 101.2 |
| B | 4 | 52 | 20298 | 195.28 | 540 | 532 | 101.2 |
| C | 10 | 22 | 21458 | 169.62 | 520 | 520 | 123.4 |
| C | 14 | 67 | 14585 | 113.94 | 520 | 520 | 123.4 |
| C | 2 | 16 | 13957 | 108.85 | 520 | 520 | 123.4 |
| D | 1 | 52 | 1558754 | 13848.27 | 496 | 482 | 112.5 |
| D | 6 | 112 | 886664 | 7875.45 | 496 | 482 | 112.5 |
| D | 7 | 80 | 181621 | 1609.77 | 496 | 482 | 112.5 |
Histogram calculated using DETX and DETY for each event in the final _common_clean file
| Quadrant A |  |
 |
Quadrant B |
|---|---|---|---|
| Quadrant D |  |
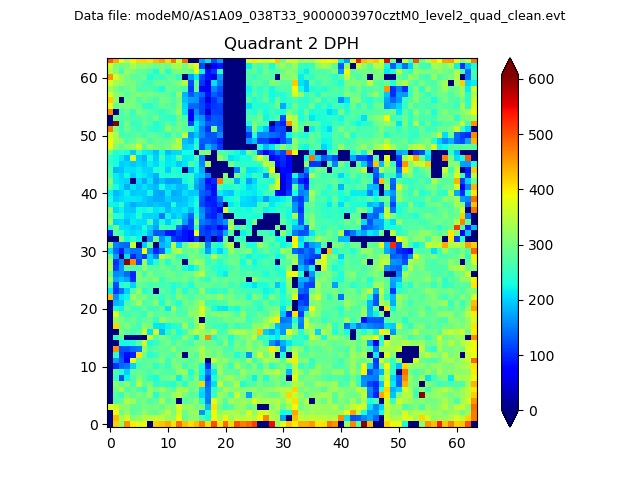 |
Quadrant C |
| Plot type | Count rate plots | Images |
|---|---|---|
| Comparison with Poisson distribution Blue bars denote a histogram of data divided into 1 sec bins. Red curve is a Poisson curve with rate = median count rate of data. |
 |
 |
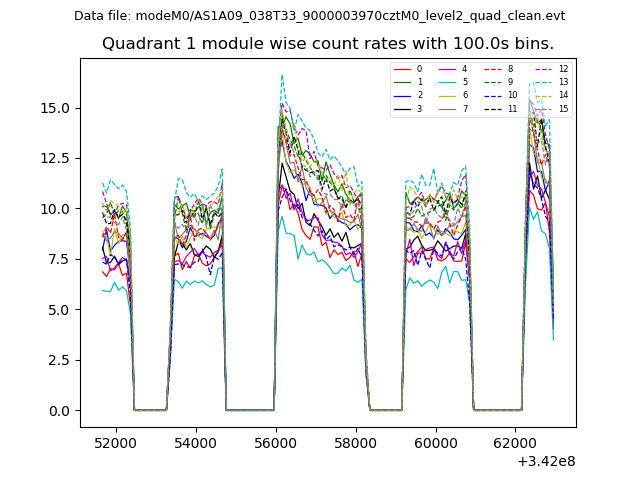
| Quadrant-wise count rates Data is divided into 100 sec bins |
 |
|
| Module-wise count rates for Quadrant A Data is divided into 100 sec bins |
 |
 |
| Module-wise count rates for Quadrant B Data is divided into 100 sec bins |
 |
 |
| Module-wise count rates for Quadrant C Data is divided into 100 sec bins |
 |
 |
| Module-wise count rates for Quadrant D Data is divided into 100 sec bins |
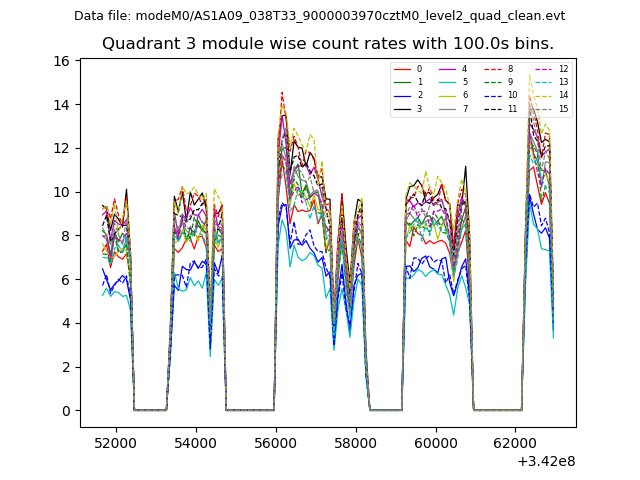 |
 |
| Parameter | Plot |
|---|---|
| CZT HV Monitor |  |
| D_VDD | 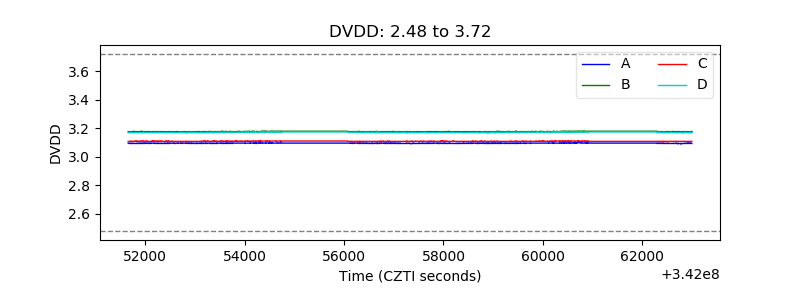 |
| Temperature 1 |  |
| Veto HV Monitor |  |
| Veto LLD |  |
| Alpha Counter |  |
| _CPM_Rate |  |
| CZT Counter |  |
| +2.5 Volts monitor |  |
| +5 Volts monitor |  |
| _ROLL_ROT |  |
| _Roll_DEC |  |
| _Roll_RA | 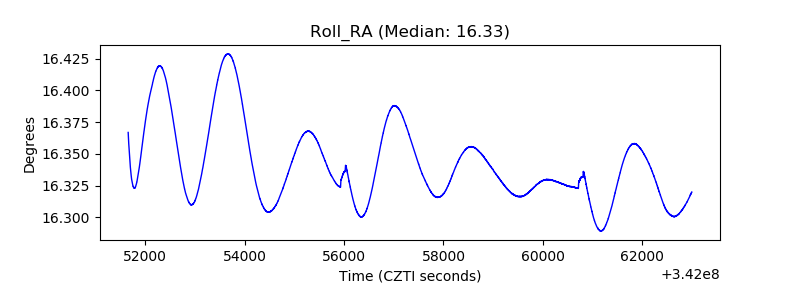 |
| Veto Counter |  |