| Param | Original file | Final file |
|---|---|---|
| Filename | modeM0/AS1A09_038T32_9000003962cztM0_level2_bc.evt | modeM0/AS1A09_038T32_9000003962cztM0_level2_quad_clean.evt |
| Size (bytes) | 185,425,920 | 78,808,320 |
| Size | 176.8 MB | 75.2 MB |
| Events in quadrant A | 1,033,933 | 519,214 |
| Events in quadrant B | 1,079,187 | 524,779 |
| Events in quadrant C | 1,155,253 | 494,160 |
| Events in quadrant D | 1,981,689 | 480,641 |
| Mode M0 | |||
|---|---|---|---|
| Quadrant | BADHDUFLAG | Total packets | Discarded packets |
| A | 0 | 10705 | 0 |
| B | 0 | 10801 | 0 |
| C | 0 | 11438 | 0 |
| D | 0 | 13721 | 0 |
| Mode M9 | |||
|---|---|---|---|
| Quadrant | BADHDUFLAG | Total packets | Discarded packets |
| A | 0 | 7 | 0 |
| B | 0 | 7 | 0 |
| C | 0 | 7 | 0 |
| D | 0 | 7 | 0 |
| Mode SS | |||
|---|---|---|---|
| Quadrant | BADHDUFLAG | Total packets | Discarded packets |
| A | 0 | 108 | 0 |
| B | 0 | 108 | 0 |
| C | 0 | 108 | 0 |
| D | 0 | 108 | 0 |
| Quadrant | Total seconds | Saturated seconds | Saturation percentage |
|---|---|---|---|
| A | 5246 | 36 | 0.686237% |
| B | 5246 | 33 | 0.629051% |
| C | 5246 | 78 | 1.486847% |
| D | 5246 | 178 | 3.393061% |
Noise dominated data is calculated using 1-second bins in cleaned event files. If a bin has >2000 counts, and if more than 50% of those come from <1% of pixels, then it is considered to be noise-dominated and hence unusable.
| Quadrant | # 1 sec bins | Bins with >0 counts | Bins with >2000 counts | High rate bins dominated by noise | Noise dominated (total time) | Noise dominated (detector-on time) | Marked lightcurve |
|---|---|---|---|---|---|---|---|
| A | 5981 | 5246 | 0 | 0 | 0.00% | 0.00% |  |
| B | 5981 | 5246 | 0 | 0 | 0.00% | 0.00% |  |
| C | 5981 | 5247 | 0 | 0 | 0.00% | 0.00% |  |
| D | 5981 | 5246 | 30 | 30 | 0.50% | 0.57% |  |
Top three noisy pixels from each quadrant. If the there are fewer than three noisy pixels in the level2.evt file, extra rows are filled as -1
| Pixel properties | Quadrant properties | ||||||
|---|---|---|---|---|---|---|---|
| Quadrant | DetID | PixID | Counts | Sigma | Mean | Median | Sigma |
| A | 8 | 192 | 8593 | 136.97 | 264 | 258 | 60.9 |
| A | 13 | 254 | 8394 | 133.7 | 264 | 258 | 60.9 |
| A | 13 | 248 | 2973 | 44.62 | 264 | 258 | 60.9 |
| B | 15 | 32 | 12875 | 232.71 | 266 | 258 | 54.2 |
| B | 10 | 245 | 11787 | 212.64 | 266 | 258 | 54.2 |
| B | 0 | 230 | 9755 | 175.16 | 266 | 258 | 54.2 |
| C | 15 | 208 | 127226 | 2039.64 | 252 | 250 | 62.3 |
| C | 2 | 16 | 46603 | 744.58 | 252 | 250 | 62.3 |
| C | 10 | 22 | 4811 | 73.26 | 252 | 250 | 62.3 |
| D | 1 | 52 | 807089 | 13130.32 | 254 | 244 | 61.4 |
| D | 7 | 80 | 42888 | 693.97 | 254 | 244 | 61.4 |
| D | 2 | 250 | 38365 | 620.37 | 254 | 244 | 61.4 |
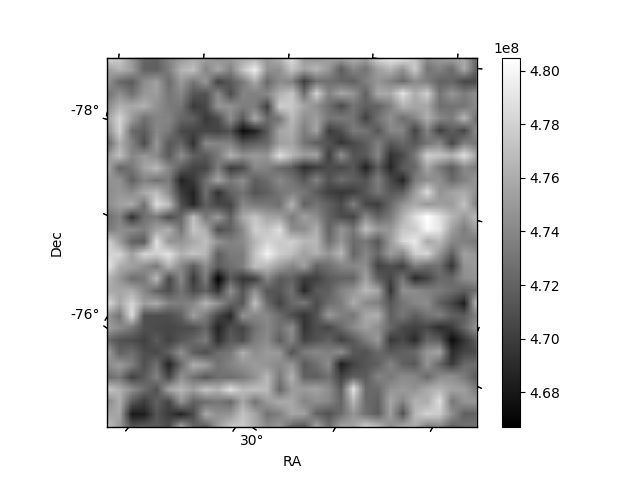
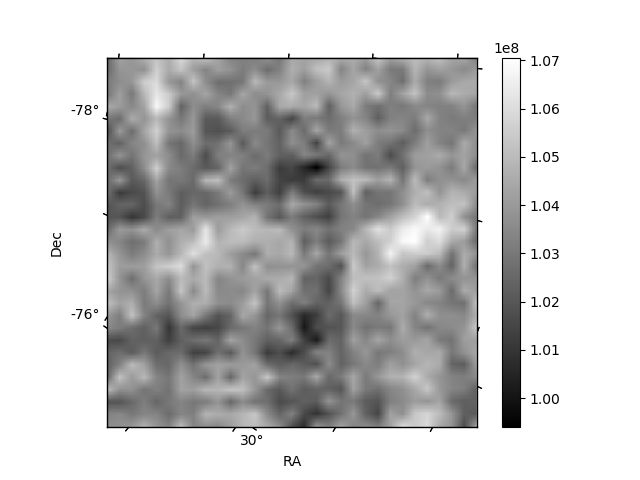
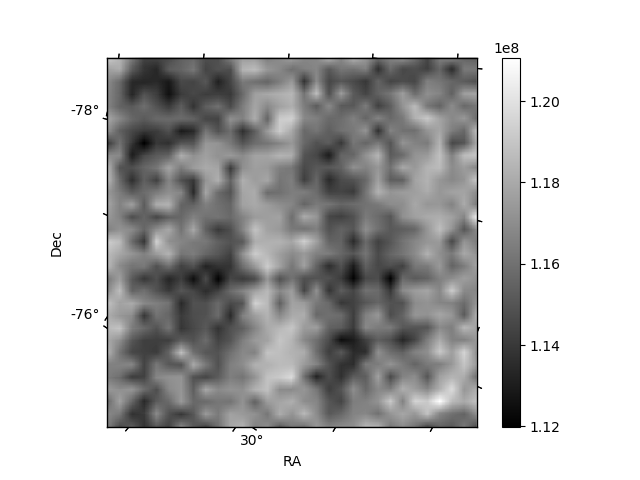
Histogram calculated using DETX and DETY for each event in the final _common_clean file
| Quadrant A |  |
 |
Quadrant B |
|---|---|---|---|
| Quadrant D |  |
 |
Quadrant C |
| Plot type | Count rate plots | Images |
|---|---|---|
| Comparison with Poisson distribution Blue bars denote a histogram of data divided into 1 sec bins. Red curve is a Poisson curve with rate = median count rate of data. |
 |
 |
| Quadrant-wise count rates Data is divided into 100 sec bins |
 |
|
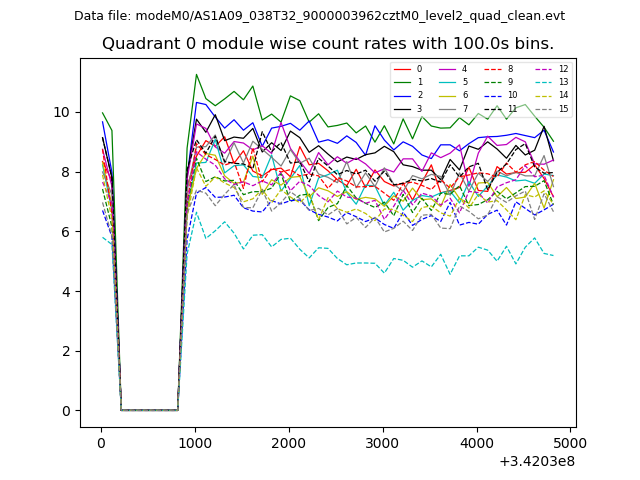
| Module-wise count rates for Quadrant A Data is divided into 100 sec bins |
 |
 |
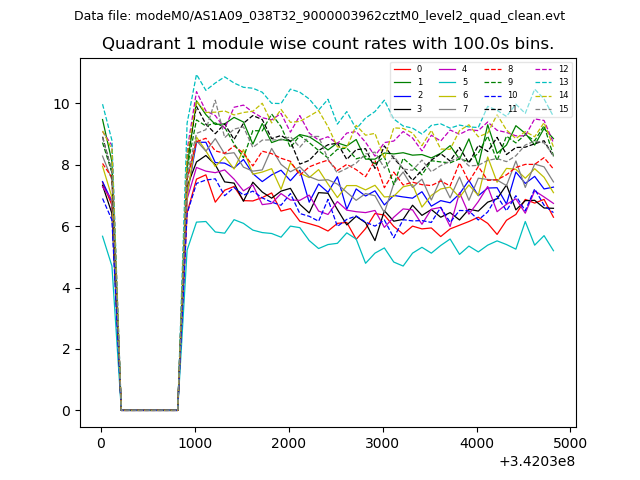
| Module-wise count rates for Quadrant B Data is divided into 100 sec bins |
 |
 |
| Module-wise count rates for Quadrant C Data is divided into 100 sec bins |
 |
 |
| Module-wise count rates for Quadrant D Data is divided into 100 sec bins |
 |
 |
| Parameter | Plot |
|---|---|
| CZT HV Monitor | 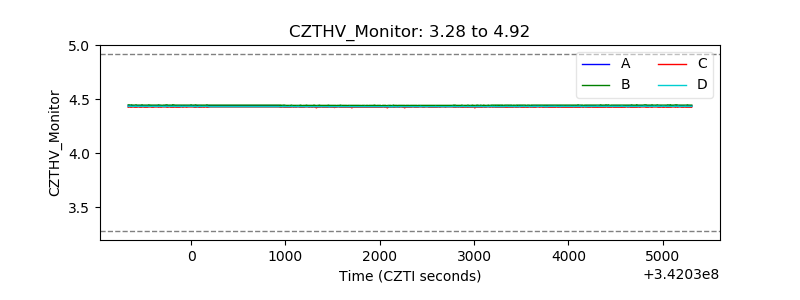 |
| D_VDD |  |
| Temperature 1 | 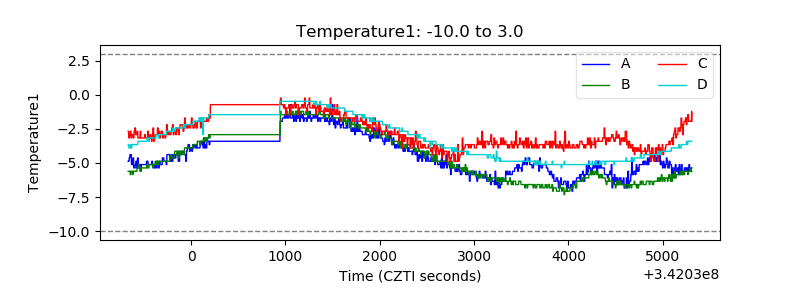 |
| Veto HV Monitor |  |
| Veto LLD | 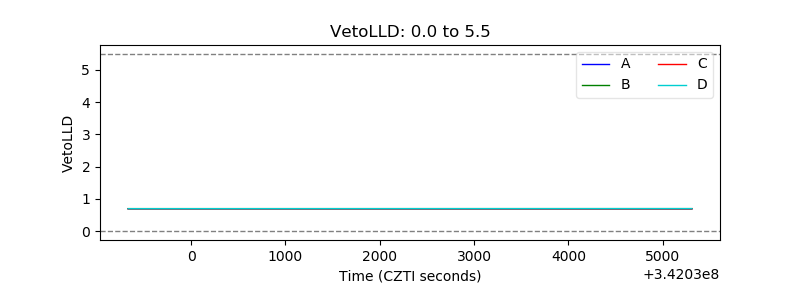 |
| Alpha Counter | 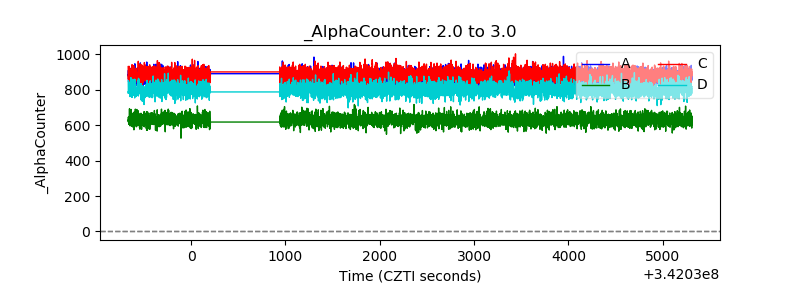 |
| _CPM_Rate | 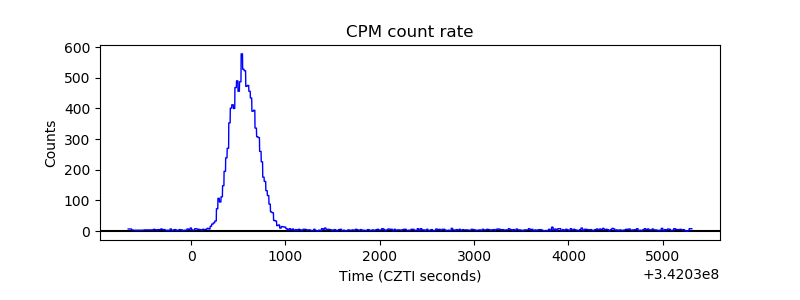 |
| CZT Counter |  |
| +2.5 Volts monitor | 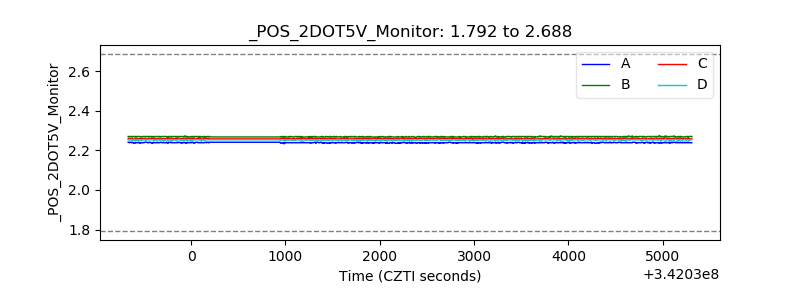 |
| +5 Volts monitor |  |
| _ROLL_ROT |  |
| _Roll_DEC |  |
| _Roll_RA |  |
| Veto Counter |  |