| Param | Original file | Final file |
|---|---|---|
| Filename | modeM0/AS1A09_038T31_9000003960cztM0_level2_bc.evt | modeM0/AS1A09_038T31_9000003960cztM0_level2_quad_clean.evt |
| Size (bytes) | 155,571,840 | 78,649,920 |
| Size | 148.4 MB | 75.0 MB |
| Events in quadrant A | 839,968 | 532,490 |
| Events in quadrant B | 1,184,571 | 531,115 |
| Events in quadrant C | 936,453 | 511,082 |
| Events in quadrant D | 1,445,345 | 500,265 |
| Mode M9 | |||
|---|---|---|---|
| Quadrant | BADHDUFLAG | Total packets | Discarded packets |
| A | 0 | 7 | 0 |
| B | 0 | 7 | 0 |
| C | 0 | 7 | 0 |
| D | 0 | 7 | 0 |
| Mode SS | |||
|---|---|---|---|
| Quadrant | BADHDUFLAG | Total packets | Discarded packets |
| A | 0 | 88 | 0 |
| B | 0 | 88 | 0 |
| C | 0 | 88 | 0 |
| D | 0 | 88 | 0 |
| Mode M0 | |||
|---|---|---|---|
| Quadrant | BADHDUFLAG | Total packets | Discarded packets |
| A | 0 | 8836 | 0 |
| B | 0 | 10101 | 0 |
| C | 0 | 9167 | 0 |
| D | 0 | 10539 | 0 |
| Quadrant | Total seconds | Saturated seconds | Saturation percentage |
|---|---|---|---|
| A | 4366 | 25 | 0.572607% |
| B | 4366 | 125 | 2.863033% |
| C | 4366 | 30 | 0.687128% |
| D | 4366 | 68 | 1.557490% |
Noise dominated data is calculated using 1-second bins in cleaned event files. If a bin has >2000 counts, and if more than 50% of those come from <1% of pixels, then it is considered to be noise-dominated and hence unusable.
| Quadrant | # 1 sec bins | Bins with >0 counts | Bins with >2000 counts | High rate bins dominated by noise | Noise dominated (total time) | Noise dominated (detector-on time) | Marked lightcurve |
|---|---|---|---|---|---|---|---|
| A | 4981 | 4366 | 1 | 1 | 0.02% | 0.02% |  |
| B | 4981 | 4366 | 0 | 0 | 0.00% | 0.00% |  |
| C | 4981 | 4366 | 0 | 0 | 0.00% | 0.00% |  |
| D | 4980 | 4365 | 15 | 15 | 0.30% | 0.34% |  |
Top three noisy pixels from each quadrant. If the there are fewer than three noisy pixels in the level2.evt file, extra rows are filled as -1
| Pixel properties | Quadrant properties | ||||||
|---|---|---|---|---|---|---|---|
| Quadrant | DetID | PixID | Counts | Sigma | Mean | Median | Sigma |
| A | 13 | 254 | 7971 | 154.9 | 214 | 210 | 50.1 |
| A | 8 | 192 | 7899 | 153.46 | 214 | 210 | 50.1 |
| A | 13 | 248 | 3775 | 71.15 | 214 | 210 | 50.1 |
| B | 4 | 52 | 250850 | 5666.07 | 212 | 207 | 44.2 |
| B | 10 | 245 | 70282 | 1584.12 | 212 | 207 | 44.2 |
| B | 15 | 32 | 15041 | 335.34 | 212 | 207 | 44.2 |
| C | 15 | 208 | 93011 | 1813.37 | 204 | 202 | 51.2 |
| C | 2 | 16 | 45293 | 881.02 | 204 | 202 | 51.2 |
| C | 10 | 22 | 6495 | 122.96 | 204 | 202 | 51.2 |
| D | 1 | 52 | 482269 | 9484.25 | 207 | 200 | 50.8 |
| D | 7 | 80 | 69684 | 1367.03 | 207 | 200 | 50.8 |
| D | 2 | 250 | 39080 | 764.93 | 207 | 200 | 50.8 |
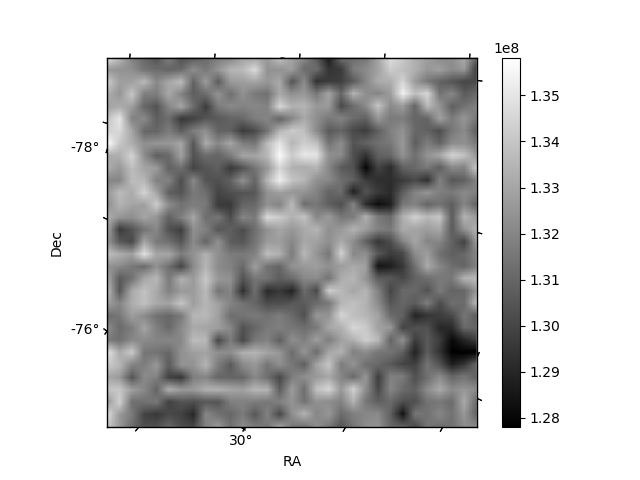
Histogram calculated using DETX and DETY for each event in the final _common_clean file
| Quadrant A |  |
 |
Quadrant B |
|---|---|---|---|
| Quadrant D |  |
 |
Quadrant C |
| Plot type | Count rate plots | Images |
|---|---|---|
| Comparison with Poisson distribution Blue bars denote a histogram of data divided into 1 sec bins. Red curve is a Poisson curve with rate = median count rate of data. |
 |
 |
| Quadrant-wise count rates Data is divided into 100 sec bins |
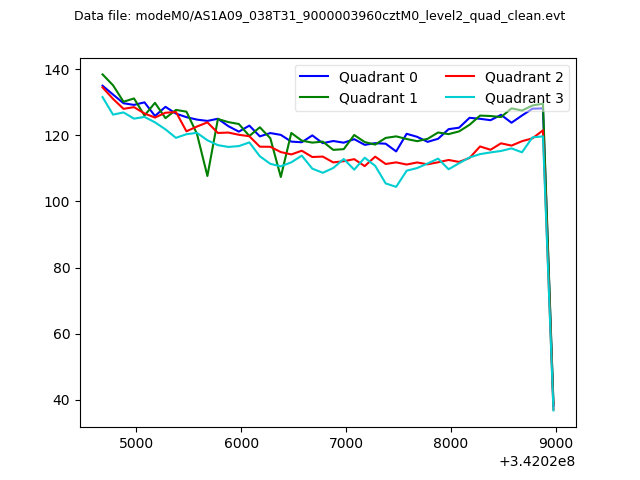 |
|
| Module-wise count rates for Quadrant A Data is divided into 100 sec bins |
 |
 |
| Module-wise count rates for Quadrant B Data is divided into 100 sec bins |
 |
 |
| Module-wise count rates for Quadrant C Data is divided into 100 sec bins |
 |
 |
| Module-wise count rates for Quadrant D Data is divided into 100 sec bins |
 |
 |
| Parameter | Plot |
|---|---|
| CZT HV Monitor |  |
| D_VDD |  |
| Temperature 1 |  |
| Veto HV Monitor |  |
| Veto LLD |  |
| Alpha Counter |  |
| _CPM_Rate |  |
| CZT Counter |  |
| +2.5 Volts monitor |  |
| +5 Volts monitor |  |
| _ROLL_ROT |  |
| _Roll_DEC |  |
| _Roll_RA |  |
| Veto Counter |  |