| Param | Original file | Final file |
|---|---|---|
| Filename | modeM0/AS1A09_038T30_9000003958cztM0_level2_bc.evt | modeM0/AS1A09_038T30_9000003958cztM0_level2_quad_clean.evt |
| Size (bytes) | 174,522,240 | 79,338,240 |
| Size | 166.4 MB | 75.7 MB |
| Events in quadrant A | 916,185 | 530,819 |
| Events in quadrant B | 968,902 | 535,832 |
| Events in quadrant C | 975,900 | 509,816 |
| Events in quadrant D | 2,091,143 | 490,921 |
| Mode M0 | |||
|---|---|---|---|
| Quadrant | BADHDUFLAG | Total packets | Discarded packets |
| A | 0 | 9587 | 0 |
| B | 0 | 9740 | 0 |
| C | 0 | 9843 | 0 |
| D | 0 | 13042 | 0 |
| Mode SS | |||
|---|---|---|---|
| Quadrant | BADHDUFLAG | Total packets | Discarded packets |
| A | 0 | 96 | 0 |
| B | 0 | 96 | 0 |
| C | 0 | 96 | 0 |
| D | 0 | 96 | 0 |
| Quadrant | Total seconds | Saturated seconds | Saturation percentage |
|---|---|---|---|
| A | 4772 | 5 | 0.104778% |
| B | 4772 | 5 | 0.104778% |
| C | 4772 | 31 | 0.649623% |
| D | 4772 | 233 | 4.882649% |
Noise dominated data is calculated using 1-second bins in cleaned event files. If a bin has >2000 counts, and if more than 50% of those come from <1% of pixels, then it is considered to be noise-dominated and hence unusable.
| Quadrant | # 1 sec bins | Bins with >0 counts | Bins with >2000 counts | High rate bins dominated by noise | Noise dominated (total time) | Noise dominated (detector-on time) | Marked lightcurve |
|---|---|---|---|---|---|---|---|
| A | 4772 | 4772 | 0 | 0 | 0.00% | 0.00% |  |
| B | 4772 | 4772 | 0 | 0 | 0.00% | 0.00% |  |
| C | 4772 | 4772 | 0 | 0 | 0.00% | 0.00% |  |
| D | 4772 | 4772 | 162 | 162 | 3.39% | 3.39% |  |
Top three noisy pixels from each quadrant. If the there are fewer than three noisy pixels in the level2.evt file, extra rows are filled as -1
| Pixel properties | Quadrant properties | ||||||
|---|---|---|---|---|---|---|---|
| Quadrant | DetID | PixID | Counts | Sigma | Mean | Median | Sigma |
| A | 13 | 254 | 7985 | 142.07 | 236 | 231 | 54.6 |
| A | 6 | 16 | 1641 | 25.83 | 236 | 231 | 54.6 |
| A | 0 | 226 | 1486 | 22.99 | 236 | 231 | 54.6 |
| B | 15 | 32 | 23628 | 475.49 | 238 | 231 | 49.2 |
| B | 10 | 245 | 21481 | 431.86 | 238 | 231 | 49.2 |
| B | 4 | 200 | 5627 | 109.66 | 238 | 231 | 49.2 |
| C | 15 | 208 | 87066 | 1534.85 | 226 | 224 | 56.6 |
| C | 10 | 22 | 8751 | 150.71 | 226 | 224 | 56.6 |
| C | 2 | 16 | 3731 | 61.98 | 226 | 224 | 56.6 |
| D | 1 | 52 | 1056998 | 19080.98 | 227 | 218 | 55.4 |
| D | 7 | 80 | 99593 | 1794.29 | 227 | 218 | 55.4 |
| D | 2 | 250 | 33266 | 596.71 | 227 | 218 | 55.4 |
Histogram calculated using DETX and DETY for each event in the final _common_clean file
| Quadrant A |  |
 |
Quadrant B |
|---|---|---|---|
| Quadrant D | 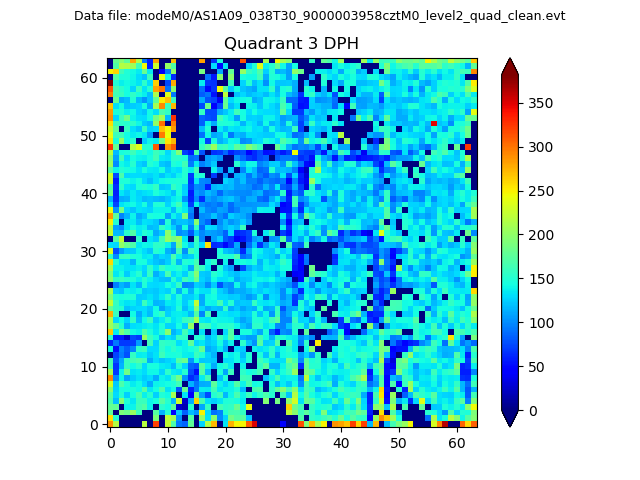 |
 |
Quadrant C |
| Plot type | Count rate plots | Images |
|---|---|---|
| Comparison with Poisson distribution Blue bars denote a histogram of data divided into 1 sec bins. Red curve is a Poisson curve with rate = median count rate of data. |
 |
 |
| Quadrant-wise count rates Data is divided into 100 sec bins |
 |
|
| Module-wise count rates for Quadrant A Data is divided into 100 sec bins |
 |
 |
| Module-wise count rates for Quadrant B Data is divided into 100 sec bins |
 |
 |
| Module-wise count rates for Quadrant C Data is divided into 100 sec bins |
 |
 |
| Module-wise count rates for Quadrant D Data is divided into 100 sec bins |
 |
 |
| Parameter | Plot |
|---|---|
| CZT HV Monitor |  |
| D_VDD |  |
| Temperature 1 |  |
| Veto HV Monitor |  |
| Veto LLD |  |
| Alpha Counter |  |
| _CPM_Rate |  |
| CZT Counter | 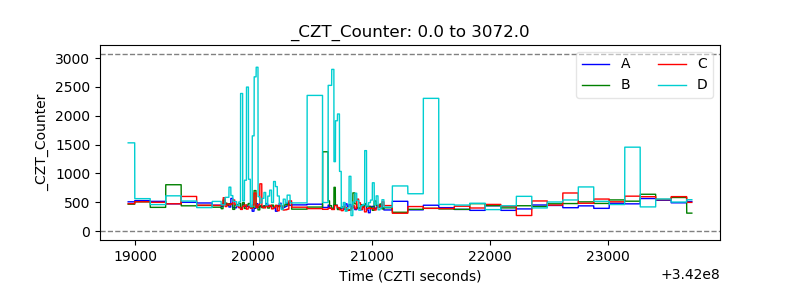 |
| +2.5 Volts monitor |  |
| +5 Volts monitor |  |
| _ROLL_ROT |  |
| _Roll_DEC |  |
| _Roll_RA |  |
| Veto Counter |  |