| Param | Original file | Final file |
|---|---|---|
| Filename | modeM0/AS1A09_038T24_9000003968cztM0_level2_bc.evt | modeM0/AS1A09_038T24_9000003968cztM0_level2_quad_clean.evt |
| Size (bytes) | 165,908,160 | 82,422,720 |
| Size | 158.2 MB | 78.6 MB |
| Events in quadrant A | 1,041,773 | 548,039 |
| Events in quadrant B | 1,134,587 | 563,583 |
| Events in quadrant C | 1,013,484 | 536,437 |
| Events in quadrant D | 1,502,123 | 513,438 |
| Mode SS | |||
|---|---|---|---|
| Quadrant | BADHDUFLAG | Total packets | Discarded packets |
| A | 0 | 98 | 0 |
| B | 0 | 98 | 0 |
| C | 0 | 98 | 0 |
| D | 0 | 98 | 0 |
| Mode M0 | |||
|---|---|---|---|
| Quadrant | BADHDUFLAG | Total packets | Discarded packets |
| A | 0 | 9909 | 0 |
| B | 0 | 10339 | 0 |
| C | 0 | 9944 | 0 |
| D | 0 | 11326 | 0 |
| Mode M9 | |||
|---|---|---|---|
| Quadrant | BADHDUFLAG | Total packets | Discarded packets |
| A | 0 | 12 | 0 |
| B | 0 | 12 | 0 |
| C | 0 | 12 | 0 |
| D | 0 | 12 | 0 |
| Quadrant | Total seconds | Saturated seconds | Saturation percentage |
|---|---|---|---|
| A | 4764 | 17 | 0.356843% |
| B | 4764 | 23 | 0.482788% |
| C | 4764 | 44 | 0.923594% |
| D | 4764 | 36 | 0.755668% |
Noise dominated data is calculated using 1-second bins in cleaned event files. If a bin has >2000 counts, and if more than 50% of those come from <1% of pixels, then it is considered to be noise-dominated and hence unusable.
| Quadrant | # 1 sec bins | Bins with >0 counts | Bins with >2000 counts | High rate bins dominated by noise | Noise dominated (total time) | Noise dominated (detector-on time) | Marked lightcurve |
|---|---|---|---|---|---|---|---|
| A | 5964 | 4764 | 0 | 0 | 0.00% | 0.00% |  |
| B | 5964 | 4764 | 0 | 0 | 0.00% | 0.00% |  |
| C | 5964 | 4764 | 0 | 0 | 0.00% | 0.00% |  |
| D | 5964 | 4764 | 13 | 13 | 0.22% | 0.27% |  |
Top three noisy pixels from each quadrant. If the there are fewer than three noisy pixels in the level2.evt file, extra rows are filled as -1
| Pixel properties | Quadrant properties | ||||||
|---|---|---|---|---|---|---|---|
| Quadrant | DetID | PixID | Counts | Sigma | Mean | Median | Sigma |
| A | 8 | 192 | 9185 | 150.5 | 267 | 262 | 59.3 |
| A | 13 | 254 | 7082 | 115.03 | 267 | 262 | 59.3 |
| A | 0 | 226 | 1692 | 24.12 | 267 | 262 | 59.3 |
| B | 3 | 64 | 44667 | 829.97 | 273 | 267 | 53.5 |
| B | 0 | 230 | 14429 | 264.72 | 273 | 267 | 53.5 |
| B | 4 | 52 | 8850 | 160.44 | 273 | 267 | 53.5 |
| C | 4 | 175 | 2777 | 39.83 | 261 | 260 | 63.2 |
| C | 1 | 16 | 2614 | 37.25 | 261 | 260 | 63.2 |
| C | 13 | 61 | 1466 | 19.09 | 261 | 260 | 63.2 |
| D | 1 | 52 | 278375 | 4602.43 | 261 | 253 | 60.4 |
| D | 6 | 112 | 130527 | 2155.81 | 261 | 253 | 60.4 |
| D | 2 | 250 | 75705 | 1248.6 | 261 | 253 | 60.4 |
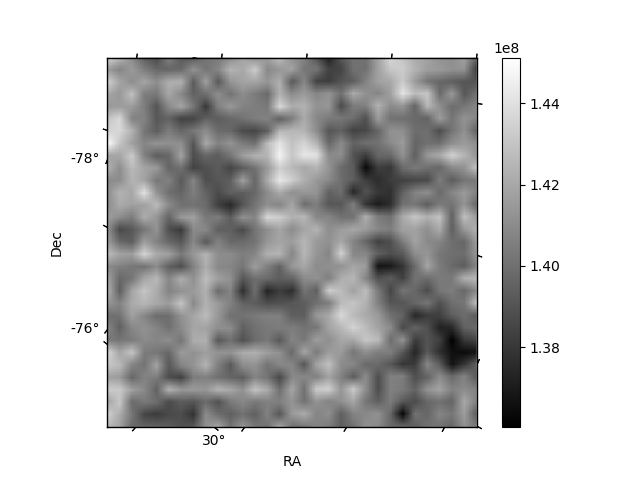
Histogram calculated using DETX and DETY for each event in the final _common_clean file
| Quadrant A |  |
 |
Quadrant B |
|---|---|---|---|
| Quadrant D |  |
 |
Quadrant C |
| Plot type | Count rate plots | Images |
|---|---|---|
| Comparison with Poisson distribution Blue bars denote a histogram of data divided into 1 sec bins. Red curve is a Poisson curve with rate = median count rate of data. |
 |
 |
| Quadrant-wise count rates Data is divided into 100 sec bins |
 |
|
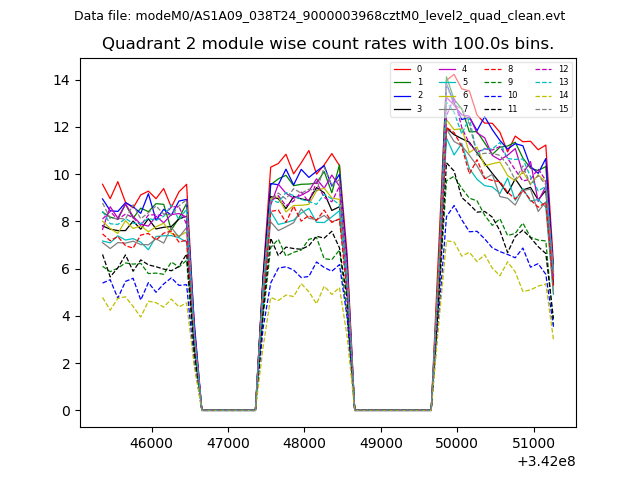
| Module-wise count rates for Quadrant A Data is divided into 100 sec bins |
 |
 |
| Module-wise count rates for Quadrant B Data is divided into 100 sec bins |
 |
 |
| Module-wise count rates for Quadrant C Data is divided into 100 sec bins |
 |
 |
| Module-wise count rates for Quadrant D Data is divided into 100 sec bins |
 |
 |
| Parameter | Plot |
|---|---|
| CZT HV Monitor |  |
| D_VDD |  |
| Temperature 1 |  |
| Veto HV Monitor |  |
| Veto LLD |  |
| Alpha Counter |  |
| _CPM_Rate |  |
| CZT Counter |  |
| +2.5 Volts monitor |  |
| +5 Volts monitor |  |
| _ROLL_ROT |  |
| _Roll_DEC |  |
| _Roll_RA |  |
| Veto Counter | 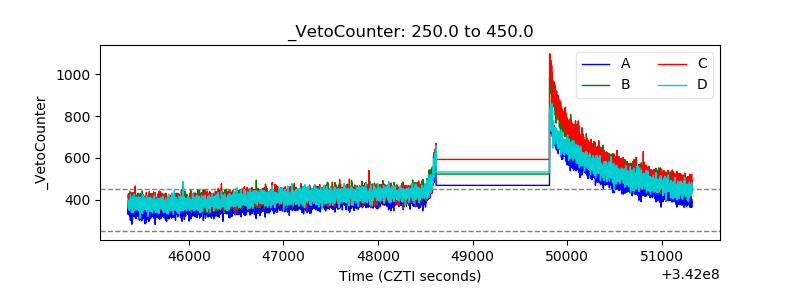 |