| Param | Original file | Final file |
|---|---|---|
| Filename | modeM0/AS1A09_038T14_9000003964cztM0_level2_bc.evt | modeM0/AS1A09_038T14_9000003964cztM0_level2_quad_clean.evt |
| Size (bytes) | 155,430,720 | 71,156,160 |
| Size | 148.2 MB | 67.9 MB |
| Events in quadrant A | 819,855 | 483,519 |
| Events in quadrant B | 1,176,134 | 482,317 |
| Events in quadrant C | 783,614 | 460,718 |
| Events in quadrant D | 1,644,017 | 442,837 |
| Mode M9 | |||
|---|---|---|---|
| Quadrant | BADHDUFLAG | Total packets | Discarded packets |
| A | 0 | 9 | 0 |
| B | 0 | 9 | 0 |
| C | 0 | 9 | 0 |
| D | 0 | 9 | 0 |
| Mode M0 | |||
|---|---|---|---|
| Quadrant | BADHDUFLAG | Total packets | Discarded packets |
| A | 0 | 8318 | 0 |
| B | 0 | 9722 | 0 |
| C | 0 | 8265 | 0 |
| D | 0 | 11029 | 0 |
| Mode SS | |||
|---|---|---|---|
| Quadrant | BADHDUFLAG | Total packets | Discarded packets |
| A | 0 | 84 | 0 |
| B | 0 | 84 | 0 |
| C | 0 | 84 | 0 |
| D | 0 | 84 | 0 |
| Quadrant | Total seconds | Saturated seconds | Saturation percentage |
|---|---|---|---|
| A | 4041 | 26 | 0.643405% |
| B | 4041 | 157 | 3.885177% |
| C | 4041 | 46 | 1.138332% |
| D | 4041 | 139 | 3.439743% |
Noise dominated data is calculated using 1-second bins in cleaned event files. If a bin has >2000 counts, and if more than 50% of those come from <1% of pixels, then it is considered to be noise-dominated and hence unusable.
| Quadrant | # 1 sec bins | Bins with >0 counts | Bins with >2000 counts | High rate bins dominated by noise | Noise dominated (total time) | Noise dominated (detector-on time) | Marked lightcurve |
|---|---|---|---|---|---|---|---|
| A | 4961 | 4041 | 1 | 1 | 0.02% | 0.02% |  |
| B | 4961 | 4041 | 3 | 3 | 0.06% | 0.07% |  |
| C | 4961 | 4041 | 0 | 0 | 0.00% | 0.00% |  |
| D | 4961 | 4041 | 25 | 25 | 0.50% | 0.62% |  |
Top three noisy pixels from each quadrant. If the there are fewer than three noisy pixels in the level2.evt file, extra rows are filled as -1
| Pixel properties | Quadrant properties | ||||||
|---|---|---|---|---|---|---|---|
| Quadrant | DetID | PixID | Counts | Sigma | Mean | Median | Sigma |
| A | 8 | 192 | 8907 | 183.74 | 208 | 204 | 47.4 |
| A | 13 | 254 | 6851 | 140.33 | 208 | 204 | 47.4 |
| A | 13 | 248 | 2977 | 58.54 | 208 | 204 | 47.4 |
| B | 10 | 245 | 319910 | 7587.83 | 207 | 203 | 42.1 |
| B | 0 | 230 | 19439 | 456.54 | 207 | 203 | 42.1 |
| B | 15 | 32 | 9635 | 223.86 | 207 | 203 | 42.1 |
| C | 7 | 221 | 7689 | 151.89 | 198 | 196 | 49.3 |
| C | 14 | 67 | 7647 | 151.04 | 198 | 196 | 49.3 |
| C | 3 | 233 | 2732 | 51.41 | 198 | 196 | 49.3 |
| D | 1 | 52 | 623001 | 12813.15 | 198 | 191 | 48.6 |
| D | 12 | 233 | 101301 | 2080.15 | 198 | 191 | 48.6 |
| D | 7 | 80 | 73186 | 1501.74 | 198 | 191 | 48.6 |
Histogram calculated using DETX and DETY for each event in the final _common_clean file
| Quadrant A |  |
 |
Quadrant B |
|---|---|---|---|
| Quadrant D |  |
 |
Quadrant C |
| Plot type | Count rate plots | Images |
|---|---|---|
| Comparison with Poisson distribution Blue bars denote a histogram of data divided into 1 sec bins. Red curve is a Poisson curve with rate = median count rate of data. |
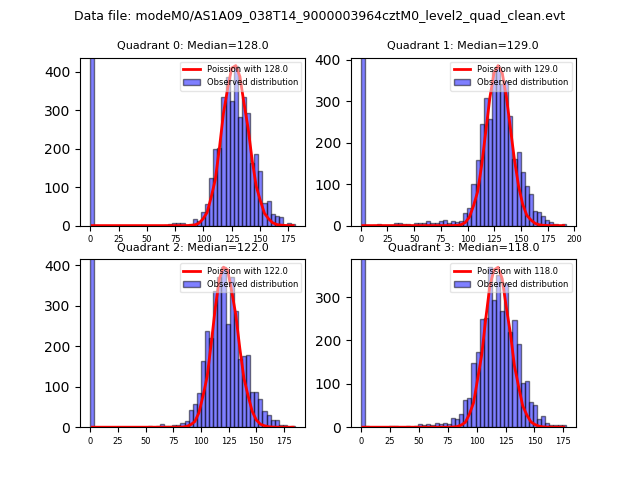 |
 |
| Quadrant-wise count rates Data is divided into 100 sec bins |
 |
|
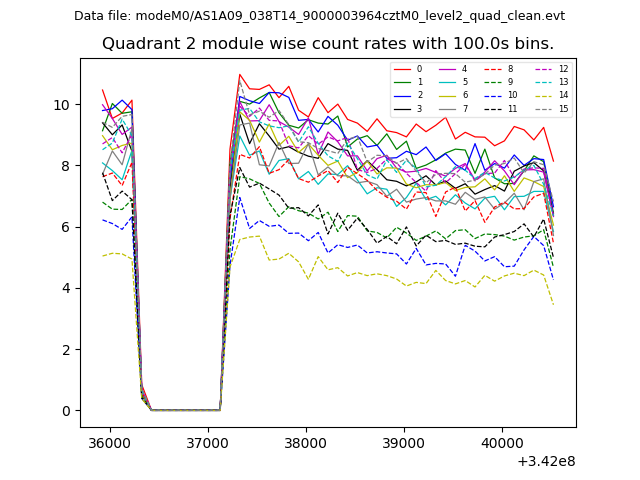
| Module-wise count rates for Quadrant A Data is divided into 100 sec bins |
 |
 |
| Module-wise count rates for Quadrant B Data is divided into 100 sec bins |
 |
 |
| Module-wise count rates for Quadrant C Data is divided into 100 sec bins |
 |
 |
| Module-wise count rates for Quadrant D Data is divided into 100 sec bins |
 |
 |
| Parameter | Plot |
|---|---|
| CZT HV Monitor | 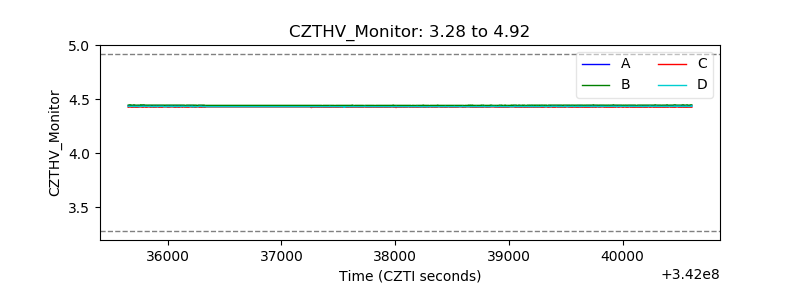 |
| D_VDD |  |
| Temperature 1 | 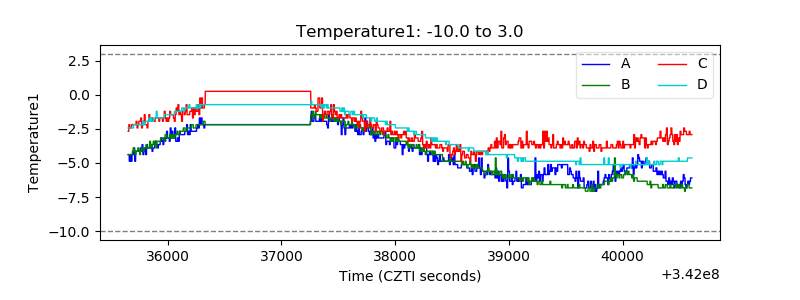 |
| Veto HV Monitor |  |
| Veto LLD |  |
| Alpha Counter |  |
| _CPM_Rate | 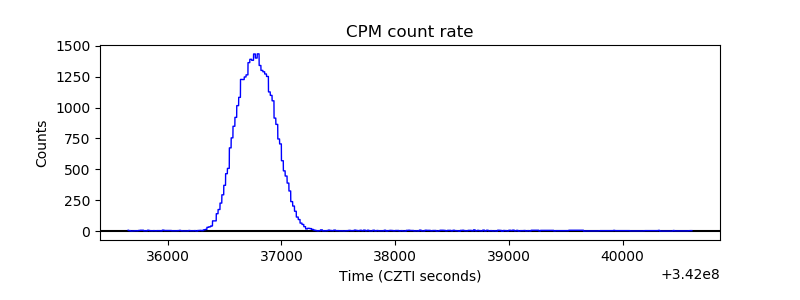 |
| CZT Counter |  |
| +2.5 Volts monitor |  |
| +5 Volts monitor |  |
| _ROLL_ROT |  |
| _Roll_DEC | 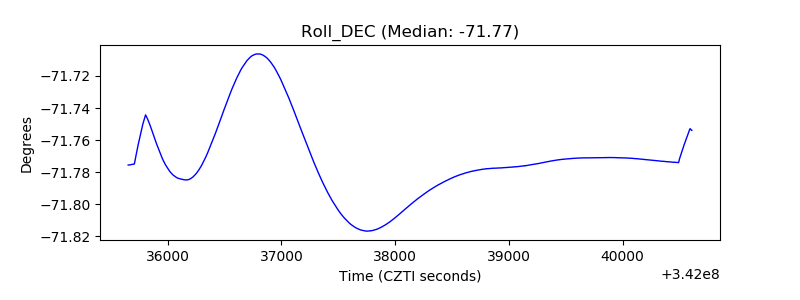 |
| _Roll_RA |  |
| Veto Counter |  |