| Param | Original file | Final file |
|---|---|---|
| Filename | modeM0/AS1A09_038T13_9000003966cztM0_level2_bc.evt | modeM0/AS1A09_038T13_9000003966cztM0_level2_quad_clean.evt |
| Size (bytes) | 98,913,600 | 47,972,160 |
| Size | 94.3 MB | 45.7 MB |
| Events in quadrant A | 661,448 | 312,099 |
| Events in quadrant B | 698,892 | 322,079 |
| Events in quadrant C | 647,607 | 306,484 |
| Events in quadrant D | 773,801 | 296,928 |
| Mode SS | |||
|---|---|---|---|
| Quadrant | BADHDUFLAG | Total packets | Discarded packets |
| A | 0 | 64 | 0 |
| B | 0 | 64 | 0 |
| C | 0 | 64 | 0 |
| D | 0 | 64 | 0 |
| Mode M9 | |||
|---|---|---|---|
| Quadrant | BADHDUFLAG | Total packets | Discarded packets |
| A | 0 | 10 | 0 |
| B | 0 | 10 | 0 |
| C | 0 | 10 | 0 |
| D | 0 | 10 | 0 |
| Mode M0 | |||
|---|---|---|---|
| Quadrant | BADHDUFLAG | Total packets | Discarded packets |
| A | 0 | 6273 | 0 |
| B | 0 | 6484 | 0 |
| C | 0 | 6277 | 0 |
| D | 0 | 6539 | 0 |
| Quadrant | Total seconds | Saturated seconds | Saturation percentage |
|---|---|---|---|
| A | 3010 | 27 | 0.897010% |
| B | 3010 | 24 | 0.797342% |
| C | 3010 | 41 | 1.362126% |
| D | 3010 | 12 | 0.398671% |
Noise dominated data is calculated using 1-second bins in cleaned event files. If a bin has >2000 counts, and if more than 50% of those come from <1% of pixels, then it is considered to be noise-dominated and hence unusable.
| Quadrant | # 1 sec bins | Bins with >0 counts | Bins with >2000 counts | High rate bins dominated by noise | Noise dominated (total time) | Noise dominated (detector-on time) | Marked lightcurve |
|---|---|---|---|---|---|---|---|
| A | 4090 | 3010 | 1 | 1 | 0.02% | 0.03% |  |
| B | 4090 | 3010 | 0 | 0 | 0.00% | 0.00% |  |
| C | 4090 | 3010 | 0 | 0 | 0.00% | 0.00% |  |
| D | 4090 | 3010 | 1 | 1 | 0.02% | 0.03% |  |
Top three noisy pixels from each quadrant. If the there are fewer than three noisy pixels in the level2.evt file, extra rows are filled as -1
| Pixel properties | Quadrant properties | ||||||
|---|---|---|---|---|---|---|---|
| Quadrant | DetID | PixID | Counts | Sigma | Mean | Median | Sigma |
| A | 8 | 192 | 9248 | 230.95 | 168 | 164 | 39.3 |
| A | 13 | 254 | 4883 | 119.98 | 168 | 164 | 39.3 |
| A | 0 | 226 | 1093 | 23.62 | 168 | 164 | 39.3 |
| B | 0 | 183 | 9870 | 273.51 | 172 | 167 | 35.5 |
| B | 0 | 230 | 8856 | 244.93 | 172 | 167 | 35.5 |
| B | 15 | 32 | 5795 | 158.65 | 172 | 167 | 35.5 |
| C | 4 | 175 | 12077 | 289.6 | 163 | 163 | 41.1 |
| C | 1 | 16 | 2169 | 48.76 | 163 | 163 | 41.1 |
| C | 7 | 221 | 1563 | 34.03 | 163 | 163 | 41.1 |
| D | 1 | 52 | 107681 | 2699.58 | 164 | 158 | 39.8 |
| D | 2 | 250 | 16349 | 406.51 | 164 | 158 | 39.8 |
| D | 2 | 234 | 12306 | 305.0 | 164 | 158 | 39.8 |
Histogram calculated using DETX and DETY for each event in the final _common_clean file
| Quadrant A | 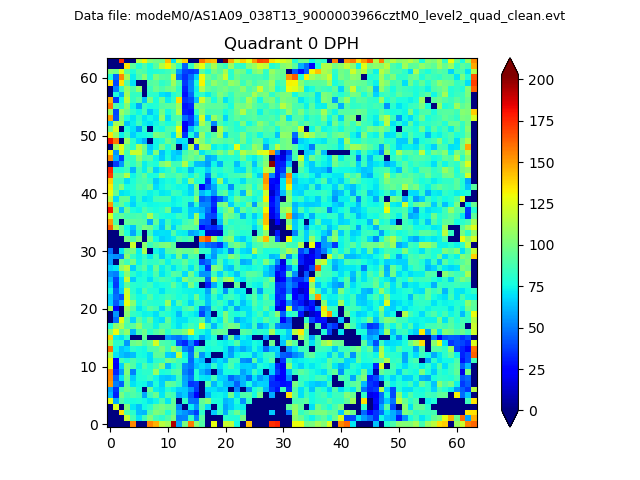 |
 |
Quadrant B |
|---|---|---|---|
| Quadrant D |  |
 |
Quadrant C |
| Plot type | Count rate plots | Images |
|---|---|---|
| Comparison with Poisson distribution Blue bars denote a histogram of data divided into 1 sec bins. Red curve is a Poisson curve with rate = median count rate of data. |
 |
 |
| Quadrant-wise count rates Data is divided into 100 sec bins |
 |
|
| Module-wise count rates for Quadrant A Data is divided into 100 sec bins |
 |
 |
| Module-wise count rates for Quadrant B Data is divided into 100 sec bins |
 |
 |
| Module-wise count rates for Quadrant C Data is divided into 100 sec bins |
 |
 |
| Module-wise count rates for Quadrant D Data is divided into 100 sec bins |
 |
 |
| Parameter | Plot |
|---|---|
| CZT HV Monitor |  |
| D_VDD | 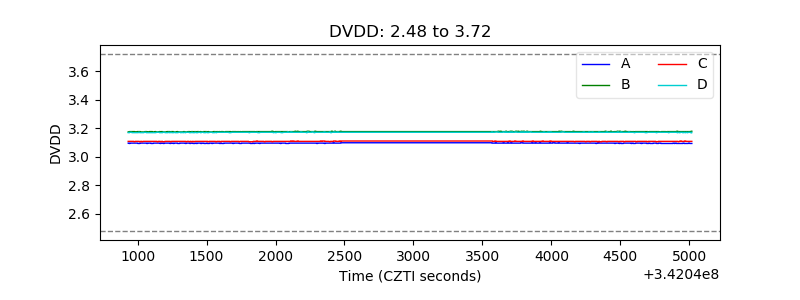 |
| Temperature 1 |  |
| Veto HV Monitor |  |
| Veto LLD | 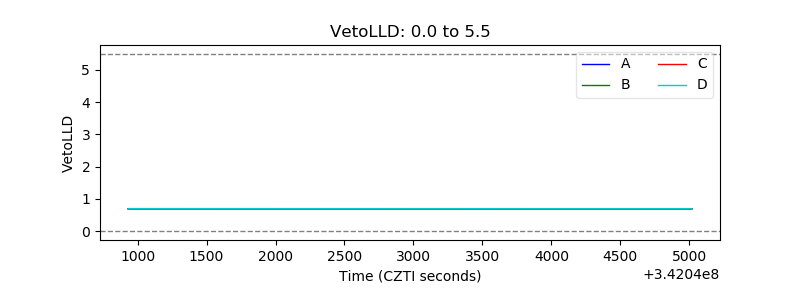 |
| Alpha Counter | 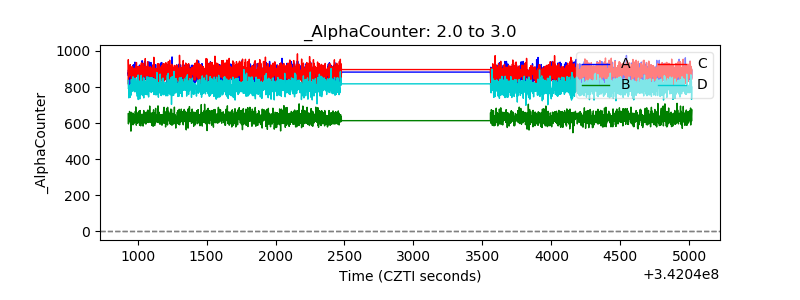 |
| _CPM_Rate | 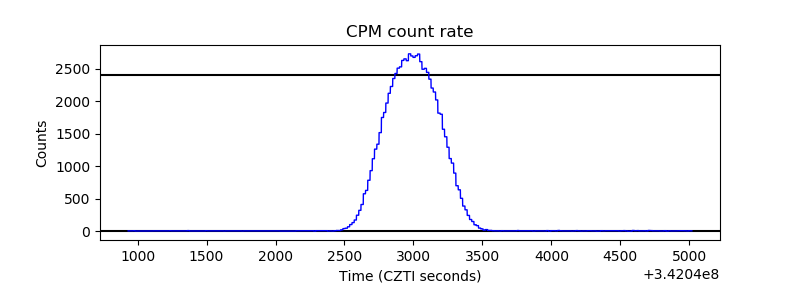 |
| CZT Counter |  |
| +2.5 Volts monitor |  |
| +5 Volts monitor | 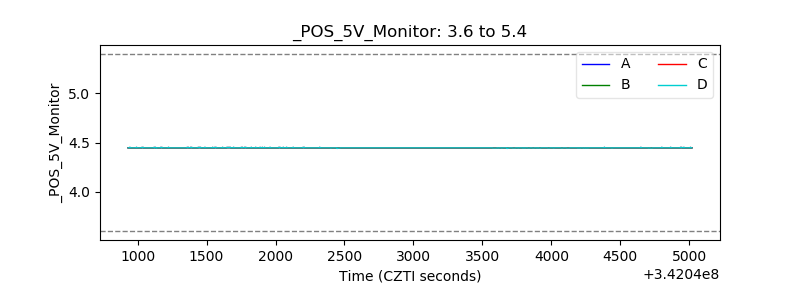 |
| _ROLL_ROT |  |
| _Roll_DEC | 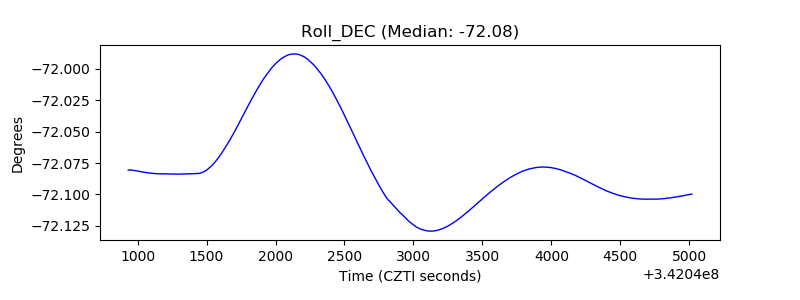 |
| _Roll_RA |  |
| Veto Counter | 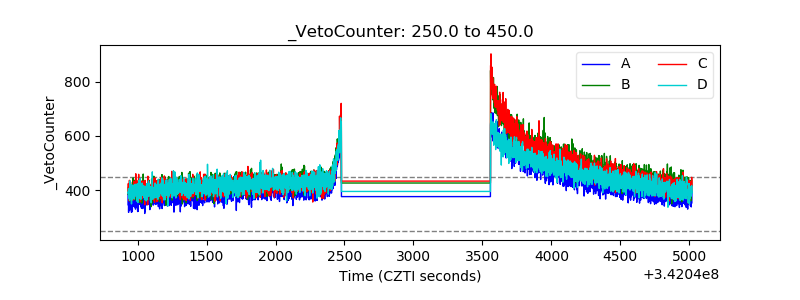 |