| Param | Original file | Final file |
|---|---|---|
| Filename | modeM0/AS1C05_019T04_9000003956cztM0_level2_bc.evt | modeM0/AS1C05_019T04_9000003956cztM0_level2_quad_clean.evt |
| Size (bytes) | 3,889,535,040 | 1,636,260,480 |
| Size | 3.6 GB | 1.5 GB |
| Events in quadrant A | 21,768,269 | 10,970,566 |
| Events in quadrant B | 25,025,693 | 11,078,764 |
| Events in quadrant C | 22,369,407 | 10,598,379 |
| Events in quadrant D | 41,874,222 | 10,114,505 |
| Mode M9 | |||
|---|---|---|---|
| Quadrant | BADHDUFLAG | Total packets | Discarded packets |
| A | 0 | 126 | 0 |
| B | 0 | 126 | 0 |
| C | 0 | 126 | 0 |
| D | 0 | 126 | 0 |
| Mode SS | |||
|---|---|---|---|
| Quadrant | BADHDUFLAG | Total packets | Discarded packets |
| A | 0 | 2020 | 0 |
| B | 0 | 2020 | 0 |
| C | 0 | 2020 | 0 |
| D | 0 | 2020 | 0 |
| Mode M0 | |||
|---|---|---|---|
| Quadrant | BADHDUFLAG | Total packets | Discarded packets |
| A | 0 | 208315 | 0 |
| B | 0 | 221080 | 0 |
| C | 0 | 214132 | 0 |
| D | 0 | 281745 | 0 |
| Quadrant | Total seconds | Saturated seconds | Saturation percentage |
|---|---|---|---|
| A | 99212 | 1377 | 1.387937% |
| B | 99212 | 2578 | 2.598476% |
| C | 99212 | 2320 | 2.338427% |
| D | 99212 | 6139 | 6.187760% |
Noise dominated data is calculated using 1-second bins in cleaned event files. If a bin has >2000 counts, and if more than 50% of those come from <1% of pixels, then it is considered to be noise-dominated and hence unusable.
| Quadrant | # 1 sec bins | Bins with >0 counts | Bins with >2000 counts | High rate bins dominated by noise | Noise dominated (total time) | Noise dominated (detector-on time) | Marked lightcurve |
|---|---|---|---|---|---|---|---|
| A | 111895 | 99201 | 62 | 62 | 0.06% | 0.06% | 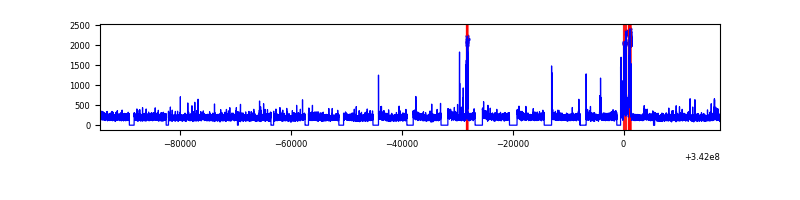 |
| B | 111895 | 99200 | 30 | 30 | 0.03% | 0.03% |  |
| C | 111895 | 99203 | 18 | 18 | 0.02% | 0.02% |  |
| D | 111895 | 99201 | 1010 | 1010 | 0.90% | 1.02% |  |
Top three noisy pixels from each quadrant. If the there are fewer than three noisy pixels in the level2.evt file, extra rows are filled as -1
| Pixel properties | Quadrant properties | ||||||
|---|---|---|---|---|---|---|---|
| Quadrant | DetID | PixID | Counts | Sigma | Mean | Median | Sigma |
| A | 15 | 174 | 1080693 | 953.55 | 5263 | 5184 | 1127.9 |
| A | 4 | 2 | 341657 | 298.32 | 5263 | 5184 | 1127.9 |
| A | 13 | 254 | 151365 | 129.6 | 5263 | 5184 | 1127.9 |
| B | 10 | 245 | 3349307 | 3335.86 | 5290 | 5169 | 1002.5 |
| B | 3 | 64 | 636755 | 630.02 | 5290 | 5169 | 1002.5 |
| B | 15 | 32 | 498389 | 492.0 | 5290 | 5169 | 1002.5 |
| C | 7 | 221 | 1932012 | 1622.61 | 5064 | 5055 | 1187.6 |
| C | 2 | 16 | 631059 | 527.13 | 5064 | 5055 | 1187.6 |
| C | 10 | 22 | 176850 | 144.66 | 5064 | 5055 | 1187.6 |
| D | 1 | 52 | 17774440 | 15239.96 | 5051 | 4893 | 1166.0 |
| D | 7 | 80 | 1959880 | 1676.68 | 5051 | 4893 | 1166.0 |
| D | 2 | 250 | 1059488 | 904.47 | 5051 | 4893 | 1166.0 |
Histogram calculated using DETX and DETY for each event in the final _common_clean file
| Quadrant A | 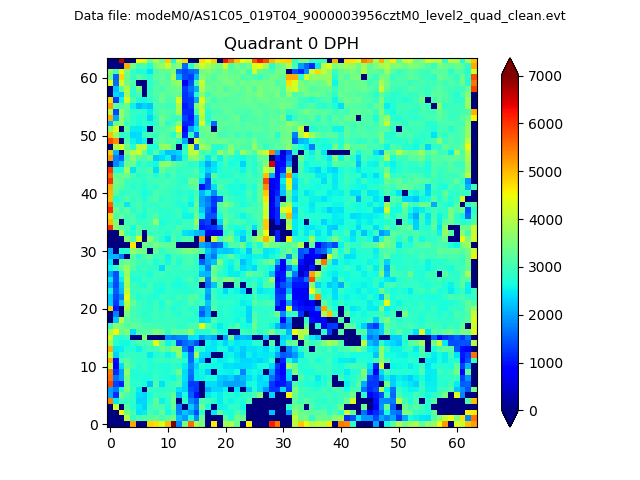 |
 |
Quadrant B |
|---|---|---|---|
| Quadrant D | 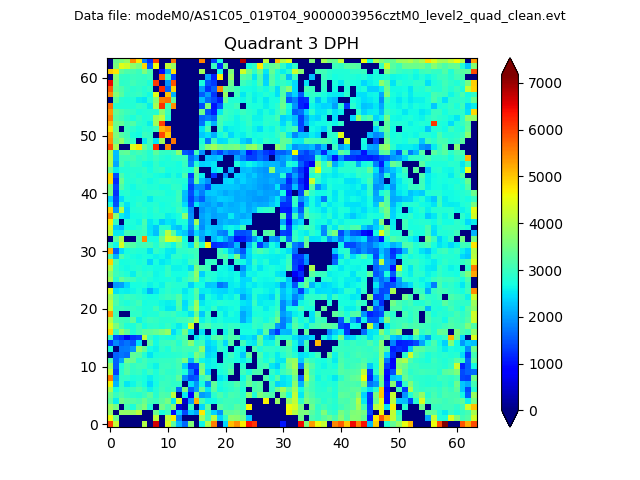 |
 |
Quadrant C |
| Plot type | Count rate plots | Images |
|---|---|---|
| Comparison with Poisson distribution Blue bars denote a histogram of data divided into 1 sec bins. Red curve is a Poisson curve with rate = median count rate of data. |
 |
 |
| Quadrant-wise count rates Data is divided into 100 sec bins |
 |
|
| Module-wise count rates for Quadrant A Data is divided into 100 sec bins |
 |
 |
| Module-wise count rates for Quadrant B Data is divided into 100 sec bins |
 |
 |
| Module-wise count rates for Quadrant C Data is divided into 100 sec bins |
 |
 |
| Module-wise count rates for Quadrant D Data is divided into 100 sec bins |
 |
 |
| Parameter | Plot |
|---|---|
| CZT HV Monitor |  |
| D_VDD | 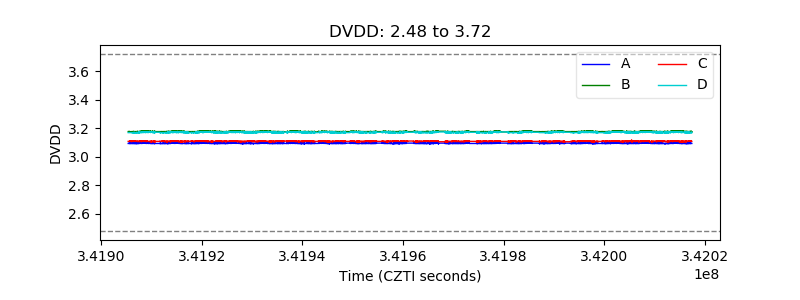 |
| Temperature 1 |  |
| Veto HV Monitor |  |
| Veto LLD |  |
| Alpha Counter | 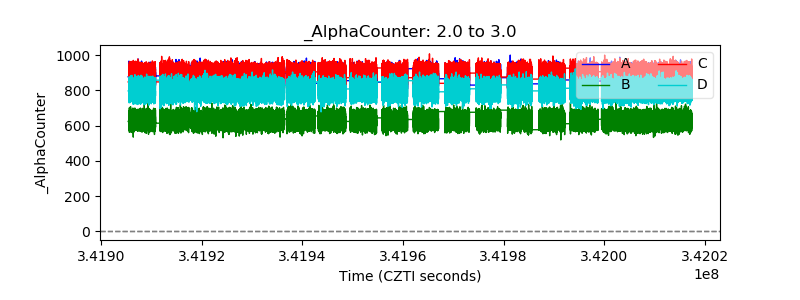 |
| _CPM_Rate |  |
| CZT Counter |  |
| +2.5 Volts monitor | 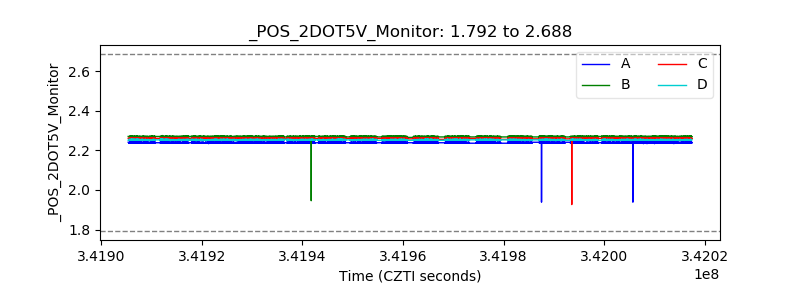 |
| +5 Volts monitor | 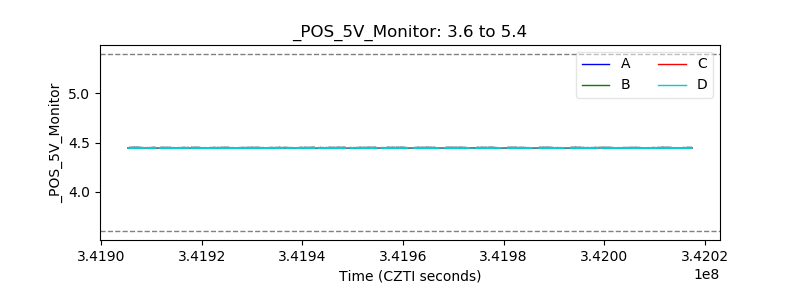 |
| _ROLL_ROT |  |
| _Roll_DEC |  |
| _Roll_RA | 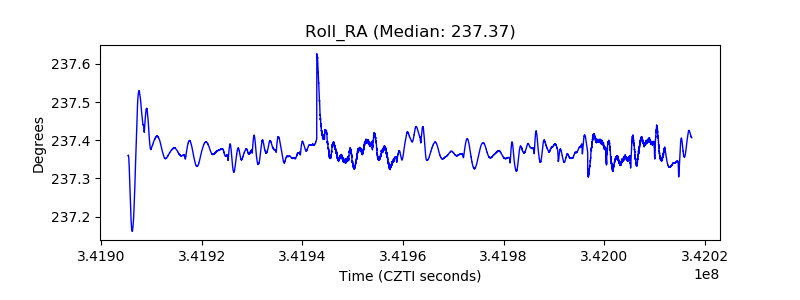 |
| Veto Counter |  |