| Param | Original file | Final file |
|---|---|---|
| Filename | modeM0/AS1A09_038T29_9000003954cztM0_level2_bc.evt | modeM0/AS1A09_038T29_9000003954cztM0_level2_quad_clean.evt |
| Size (bytes) | 754,087,680 | 296,193,600 |
| Size | 719.2 MB | 282.5 MB |
| Events in quadrant A | 4,201,462 | 1,977,228 |
| Events in quadrant B | 5,377,945 | 1,989,179 |
| Events in quadrant C | 4,209,202 | 1,978,380 |
| Events in quadrant D | 7,856,995 | 1,826,030 |
| Mode M0 | |||
|---|---|---|---|
| Quadrant | BADHDUFLAG | Total packets | Discarded packets |
| A | 0 | 36532 | 0 |
| B | 0 | 42733 | 0 |
| C | 0 | 37660 | 0 |
| D | 0 | 52188 | 0 |
| Mode M9 | |||
|---|---|---|---|
| Quadrant | BADHDUFLAG | Total packets | Discarded packets |
| A | 0 | 40 | 0 |
| B | 0 | 40 | 0 |
| C | 0 | 40 | 0 |
| D | 0 | 40 | 0 |
| Mode SS | |||
|---|---|---|---|
| Quadrant | BADHDUFLAG | Total packets | Discarded packets |
| A | 0 | 356 | 0 |
| B | 0 | 356 | 0 |
| C | 0 | 356 | 0 |
| D | 0 | 356 | 0 |
| Quadrant | Total seconds | Saturated seconds | Saturation percentage |
|---|---|---|---|
| A | 17411 | 83 | 0.476710% |
| B | 17411 | 727 | 4.175521% |
| C | 17411 | 218 | 1.252082% |
| D | 17410 | 1215 | 6.978748% |
Noise dominated data is calculated using 1-second bins in cleaned event files. If a bin has >2000 counts, and if more than 50% of those come from <1% of pixels, then it is considered to be noise-dominated and hence unusable.
| Quadrant | # 1 sec bins | Bins with >0 counts | Bins with >2000 counts | High rate bins dominated by noise | Noise dominated (total time) | Noise dominated (detector-on time) | Marked lightcurve |
|---|---|---|---|---|---|---|---|
| A | 21437 | 17412 | 37 | 37 | 0.17% | 0.21% |  |
| B | 21437 | 17411 | 14 | 14 | 0.07% | 0.08% |  |
| C | 21437 | 17412 | 0 | 0 | 0.00% | 0.00% |  |
| D | 21437 | 17410 | 74 | 74 | 0.35% | 0.43% |  |
Top three noisy pixels from each quadrant. If the there are fewer than three noisy pixels in the level2.evt file, extra rows are filled as -1
| Pixel properties | Quadrant properties | ||||||
|---|---|---|---|---|---|---|---|
| Quadrant | DetID | PixID | Counts | Sigma | Mean | Median | Sigma |
| A | 6 | 16 | 118440 | 525.52 | 1059 | 1047 | 223.4 |
| A | 13 | 254 | 26505 | 113.97 | 1059 | 1047 | 223.4 |
| A | 0 | 226 | 6631 | 25.0 | 1059 | 1047 | 223.4 |
| B | 10 | 245 | 1045668 | 5374.92 | 1066 | 1048 | 194.4 |
| B | 4 | 52 | 75628 | 383.74 | 1066 | 1048 | 194.4 |
| B | 15 | 32 | 66676 | 337.68 | 1066 | 1048 | 194.4 |
| C | 2 | 16 | 150938 | 612.1 | 1053 | 1055 | 244.9 |
| C | 8 | 208 | 9049 | 32.65 | 1053 | 1055 | 244.9 |
| C | 13 | 61 | 5977 | 20.1 | 1053 | 1055 | 244.9 |
| D | 1 | 52 | 3669819 | 16067.43 | 1026 | 999 | 228.3 |
| D | 2 | 250 | 86327 | 373.69 | 1026 | 999 | 228.3 |
| D | 6 | 112 | 73421 | 317.17 | 1026 | 999 | 228.3 |
Histogram calculated using DETX and DETY for each event in the final _common_clean file
| Quadrant A |  |
 |
Quadrant B |
|---|---|---|---|
| Quadrant D |  |
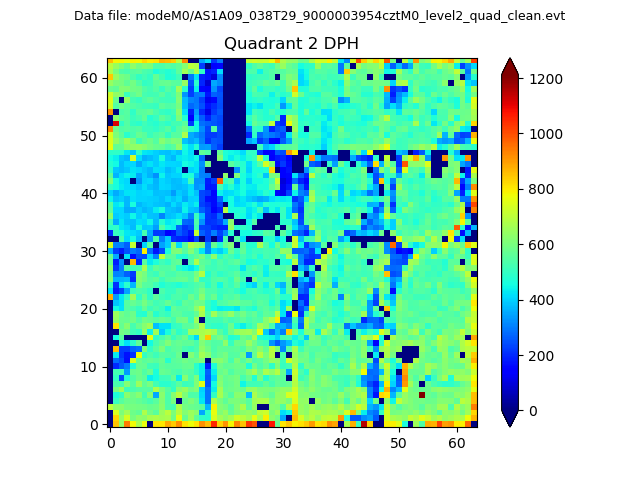 |
Quadrant C |
| Plot type | Count rate plots | Images |
|---|---|---|
| Comparison with Poisson distribution Blue bars denote a histogram of data divided into 1 sec bins. Red curve is a Poisson curve with rate = median count rate of data. |
 |
 |
| Quadrant-wise count rates Data is divided into 100 sec bins |
 |
|
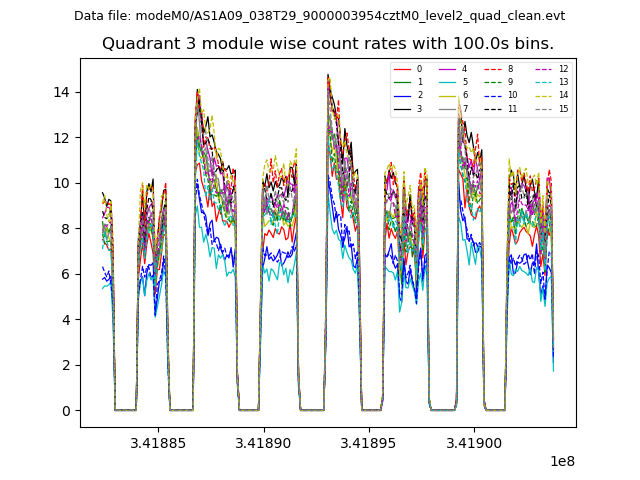
| Module-wise count rates for Quadrant A Data is divided into 100 sec bins |
 |
 |
| Module-wise count rates for Quadrant B Data is divided into 100 sec bins |
 |
 |
| Module-wise count rates for Quadrant C Data is divided into 100 sec bins |
 |
 |
| Module-wise count rates for Quadrant D Data is divided into 100 sec bins |
 |
 |
| Parameter | Plot |
|---|---|
| CZT HV Monitor |  |
| D_VDD |  |
| Temperature 1 |  |
| Veto HV Monitor |  |
| Veto LLD |  |
| Alpha Counter |  |
| _CPM_Rate |  |
| CZT Counter |  |
| +2.5 Volts monitor |  |
| +5 Volts monitor |  |
| _ROLL_ROT |  |
| _Roll_DEC | 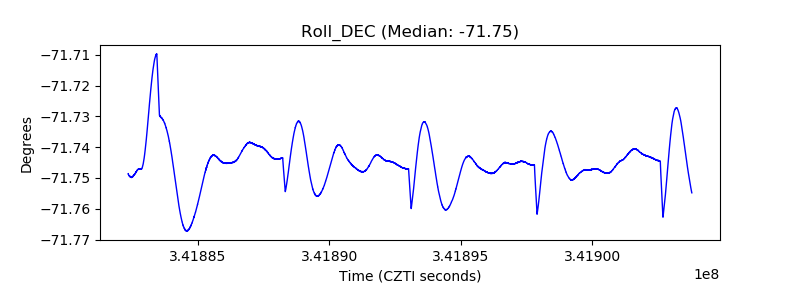 |
| _Roll_RA |  |
| Veto Counter |  |