| Param | Original file | Final file |
|---|---|---|
| Filename | modeM0/AS1A09_038T28_9000003952cztM0_level2_bc.evt | modeM0/AS1A09_038T28_9000003952cztM0_level2_quad_clean.evt |
| Size (bytes) | 217,532,160 | 79,453,440 |
| Size | 207.5 MB | 75.8 MB |
| Events in quadrant A | 1,104,347 | 530,498 |
| Events in quadrant B | 1,212,904 | 546,891 |
| Events in quadrant C | 1,067,096 | 520,139 |
| Events in quadrant D | 2,868,984 | 471,479 |
| Mode M9 | |||
|---|---|---|---|
| Quadrant | BADHDUFLAG | Total packets | Discarded packets |
| A | 0 | 12 | 0 |
| B | 0 | 12 | 0 |
| C | 0 | 12 | 0 |
| D | 0 | 12 | 0 |
| Mode SS | |||
|---|---|---|---|
| Quadrant | BADHDUFLAG | Total packets | Discarded packets |
| A | 0 | 98 | 0 |
| B | 0 | 98 | 0 |
| C | 0 | 98 | 0 |
| D | 0 | 98 | 0 |
| Mode M0 | |||
|---|---|---|---|
| Quadrant | BADHDUFLAG | Total packets | Discarded packets |
| A | 0 | 10080 | 0 |
| B | 0 | 10593 | 0 |
| C | 0 | 10166 | 0 |
| D | 0 | 17411 | 0 |
| Quadrant | Total seconds | Saturated seconds | Saturation percentage |
|---|---|---|---|
| A | 4801 | 36 | 0.749844% |
| B | 4801 | 76 | 1.583004% |
| C | 4801 | 68 | 1.416372% |
| D | 4801 | 608 | 12.664028% |
Noise dominated data is calculated using 1-second bins in cleaned event files. If a bin has >2000 counts, and if more than 50% of those come from <1% of pixels, then it is considered to be noise-dominated and hence unusable.
| Quadrant | # 1 sec bins | Bins with >0 counts | Bins with >2000 counts | High rate bins dominated by noise | Noise dominated (total time) | Noise dominated (detector-on time) | Marked lightcurve |
|---|---|---|---|---|---|---|---|
| A | 5981 | 4801 | 12 | 12 | 0.20% | 0.25% |  |
| B | 5981 | 4800 | 0 | 0 | 0.00% | 0.00% |  |
| C | 5981 | 4800 | 1 | 1 | 0.02% | 0.02% |  |
| D | 5981 | 4800 | 36 | 36 | 0.60% | 0.75% |  |
Top three noisy pixels from each quadrant. If the there are fewer than three noisy pixels in the level2.evt file, extra rows are filled as -1
| Pixel properties | Quadrant properties | ||||||
|---|---|---|---|---|---|---|---|
| Quadrant | DetID | PixID | Counts | Sigma | Mean | Median | Sigma |
| A | 6 | 16 | 35240 | 583.9 | 270 | 265 | 59.9 |
| A | 15 | 174 | 25775 | 425.88 | 270 | 265 | 59.9 |
| A | 13 | 254 | 7568 | 121.92 | 270 | 265 | 59.9 |
| B | 10 | 245 | 109312 | 2000.19 | 277 | 270 | 54.5 |
| B | 0 | 230 | 14559 | 262.1 | 277 | 270 | 54.5 |
| B | 15 | 32 | 12070 | 216.44 | 277 | 270 | 54.5 |
| C | 2 | 16 | 29144 | 451.34 | 265 | 263 | 64.0 |
| C | 8 | 128 | 7105 | 106.92 | 265 | 263 | 64.0 |
| C | 7 | 221 | 3573 | 51.73 | 265 | 263 | 64.0 |
| D | 1 | 52 | 1540163 | 26475.34 | 251 | 242 | 58.2 |
| D | 7 | 80 | 337324 | 5795.34 | 251 | 242 | 58.2 |
| D | 2 | 234 | 16260 | 275.39 | 251 | 242 | 58.2 |
Histogram calculated using DETX and DETY for each event in the final _common_clean file
| Quadrant A | 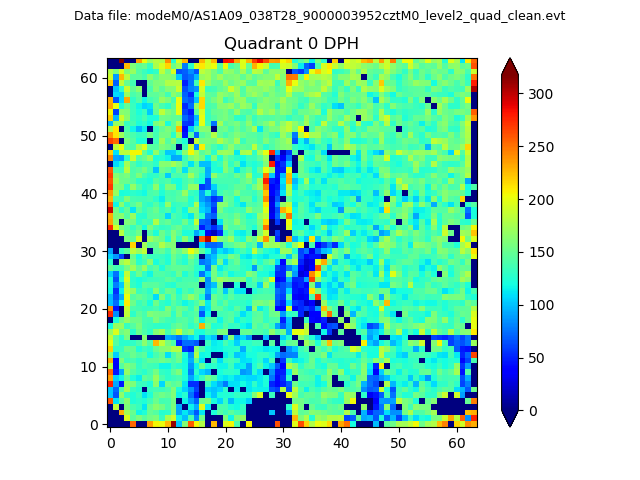 |
 |
Quadrant B |
|---|---|---|---|
| Quadrant D |  |
 |
Quadrant C |
| Plot type | Count rate plots | Images |
|---|---|---|
| Comparison with Poisson distribution Blue bars denote a histogram of data divided into 1 sec bins. Red curve is a Poisson curve with rate = median count rate of data. |
 |
 |
| Quadrant-wise count rates Data is divided into 100 sec bins |
 |
|
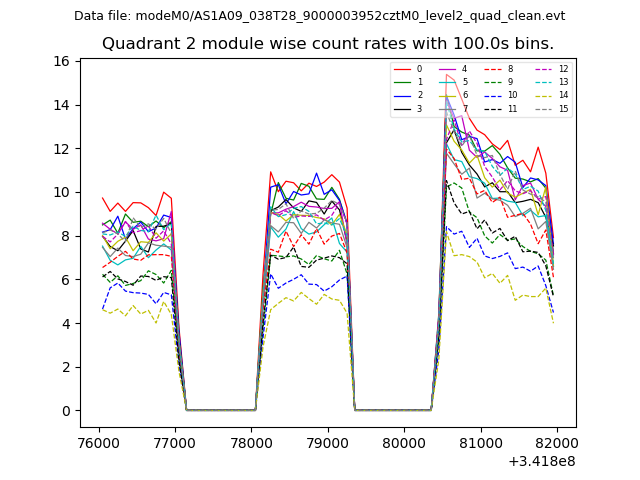
| Module-wise count rates for Quadrant A Data is divided into 100 sec bins |
 |
 |
| Module-wise count rates for Quadrant B Data is divided into 100 sec bins |
 |
 |
| Module-wise count rates for Quadrant C Data is divided into 100 sec bins |
 |
 |
| Module-wise count rates for Quadrant D Data is divided into 100 sec bins |
 |
 |
| Parameter | Plot |
|---|---|
| CZT HV Monitor |  |
| D_VDD |  |
| Temperature 1 |  |
| Veto HV Monitor |  |
| Veto LLD |  |
| Alpha Counter |  |
| _CPM_Rate |  |
| CZT Counter |  |
| +2.5 Volts monitor |  |
| +5 Volts monitor | 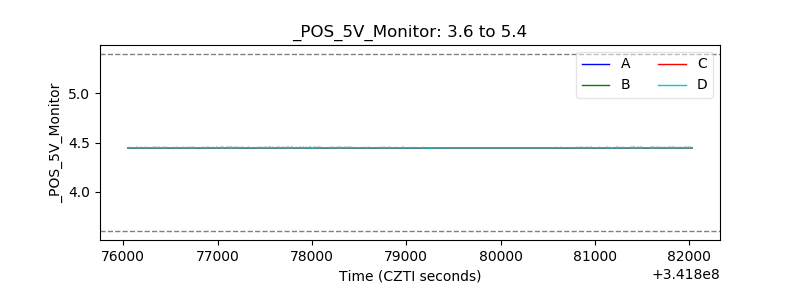 |
| _ROLL_ROT |  |
| _Roll_DEC |  |
| _Roll_RA |  |
| Veto Counter | 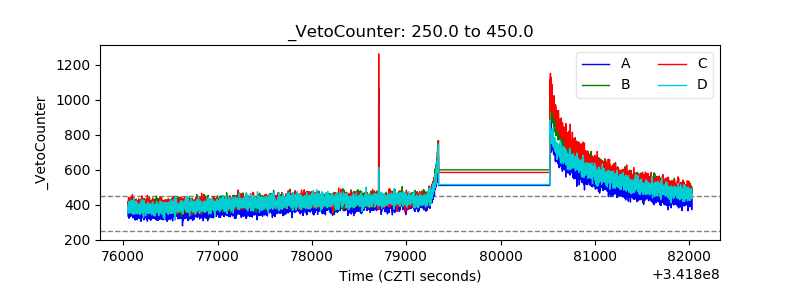 |