| Param | Original file | Final file |
|---|---|---|
| Filename | modeM0/AS1A09_038T27_9000003950cztM0_level2_bc.evt | modeM0/AS1A09_038T27_9000003950cztM0_level2_quad_clean.evt |
| Size (bytes) | 159,364,800 | 73,419,840 |
| Size | 152.0 MB | 70.0 MB |
| Events in quadrant A | 966,977 | 483,564 |
| Events in quadrant B | 1,154,050 | 493,458 |
| Events in quadrant C | 950,265 | 468,521 |
| Events in quadrant D | 1,428,405 | 449,287 |
| Mode SS | |||
|---|---|---|---|
| Quadrant | BADHDUFLAG | Total packets | Discarded packets |
| A | 0 | 96 | 0 |
| B | 0 | 96 | 0 |
| C | 0 | 96 | 0 |
| D | 0 | 96 | 0 |
| Mode M9 | |||
|---|---|---|---|
| Quadrant | BADHDUFLAG | Total packets | Discarded packets |
| A | 0 | 10 | 0 |
| B | 0 | 10 | 0 |
| C | 0 | 10 | 0 |
| D | 0 | 10 | 0 |
| Mode M0 | |||
|---|---|---|---|
| Quadrant | BADHDUFLAG | Total packets | Discarded packets |
| A | 0 | 9585 | 0 |
| B | 0 | 10372 | 0 |
| C | 0 | 9656 | 0 |
| D | 0 | 11217 | 0 |
| Quadrant | Total seconds | Saturated seconds | Saturation percentage |
|---|---|---|---|
| A | 4675 | 27 | 0.577540% |
| B | 4675 | 84 | 1.796791% |
| C | 4675 | 41 | 0.877005% |
| D | 4675 | 114 | 2.438503% |
Noise dominated data is calculated using 1-second bins in cleaned event files. If a bin has >2000 counts, and if more than 50% of those come from <1% of pixels, then it is considered to be noise-dominated and hence unusable.
| Quadrant | # 1 sec bins | Bins with >0 counts | Bins with >2000 counts | High rate bins dominated by noise | Noise dominated (total time) | Noise dominated (detector-on time) | Marked lightcurve |
|---|---|---|---|---|---|---|---|
| A | 5740 | 4674 | 0 | 0 | 0.00% | 0.00% |  |
| B | 5740 | 4674 | 6 | 6 | 0.10% | 0.13% |  |
| C | 5740 | 4674 | 0 | 0 | 0.00% | 0.00% |  |
| D | 5740 | 4674 | 34 | 34 | 0.59% | 0.73% |  |
Top three noisy pixels from each quadrant. If the there are fewer than three noisy pixels in the level2.evt file, extra rows are filled as -1
| Pixel properties | Quadrant properties | ||||||
|---|---|---|---|---|---|---|---|
| Quadrant | DetID | PixID | Counts | Sigma | Mean | Median | Sigma |
| A | 13 | 254 | 7508 | 127.85 | 249 | 244 | 56.8 |
| A | 15 | 174 | 2559 | 40.75 | 249 | 244 | 56.8 |
| A | 0 | 226 | 1567 | 23.29 | 249 | 244 | 56.8 |
| B | 10 | 245 | 142368 | 2846.76 | 251 | 245 | 49.9 |
| B | 15 | 33 | 13983 | 275.18 | 251 | 245 | 49.9 |
| B | 15 | 32 | 11207 | 219.57 | 251 | 245 | 49.9 |
| C | 2 | 16 | 12755 | 212.64 | 241 | 240 | 58.9 |
| C | 8 | 128 | 4168 | 66.74 | 241 | 240 | 58.9 |
| C | 7 | 221 | 3235 | 50.89 | 241 | 240 | 58.9 |
| D | 1 | 52 | 431398 | 7467.17 | 241 | 232 | 57.7 |
| D | 2 | 250 | 50642 | 873.03 | 241 | 232 | 57.7 |
| D | 2 | 234 | 18292 | 312.77 | 241 | 232 | 57.7 |
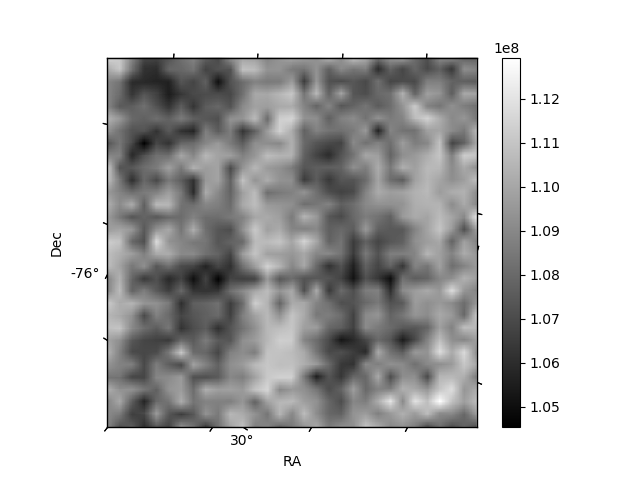
Histogram calculated using DETX and DETY for each event in the final _common_clean file
| Quadrant A |  |
 |
Quadrant B |
|---|---|---|---|
| Quadrant D |  |
 |
Quadrant C |
| Plot type | Count rate plots | Images |
|---|---|---|
| Comparison with Poisson distribution Blue bars denote a histogram of data divided into 1 sec bins. Red curve is a Poisson curve with rate = median count rate of data. |
 |
 |
| Quadrant-wise count rates Data is divided into 100 sec bins |
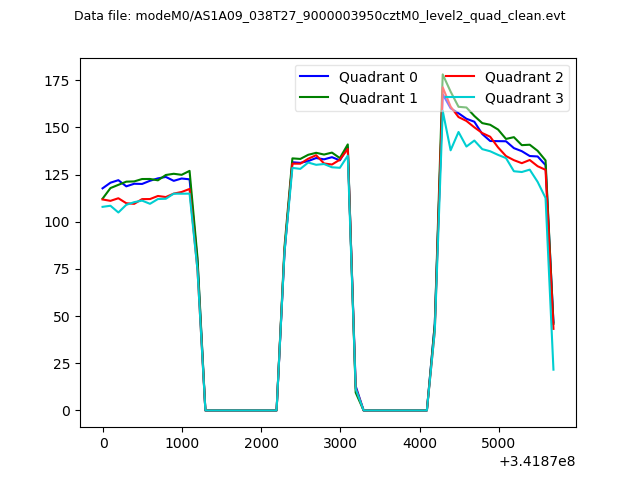 |
|
| Module-wise count rates for Quadrant A Data is divided into 100 sec bins |
 |
 |
| Module-wise count rates for Quadrant B Data is divided into 100 sec bins |
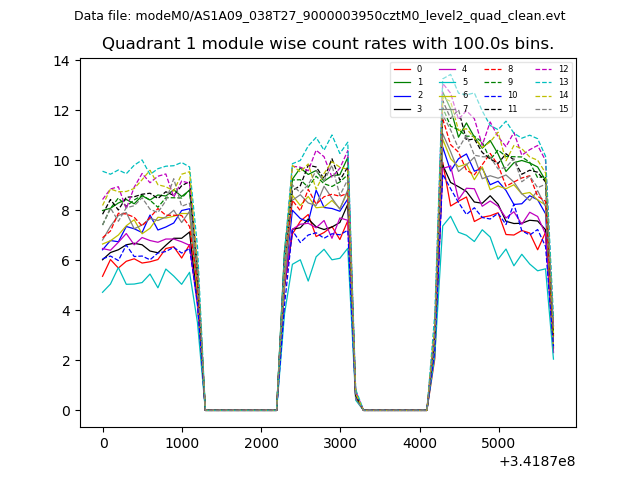 |
 |
| Module-wise count rates for Quadrant C Data is divided into 100 sec bins |
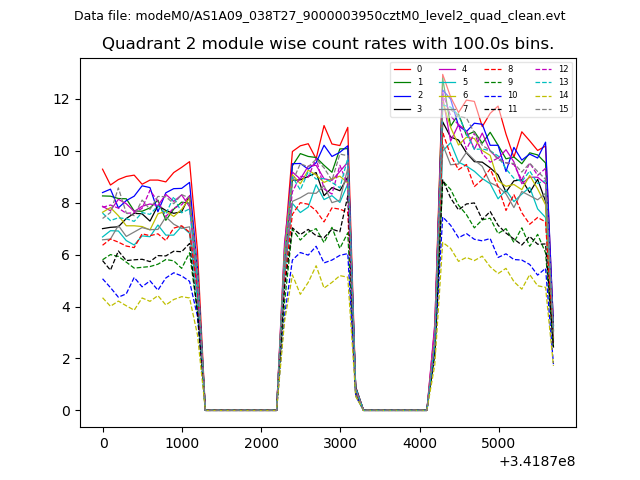 |
 |
| Module-wise count rates for Quadrant D Data is divided into 100 sec bins |
 |
 |
| Parameter | Plot |
|---|---|
| CZT HV Monitor |  |
| D_VDD |  |
| Temperature 1 |  |
| Veto HV Monitor |  |
| Veto LLD | 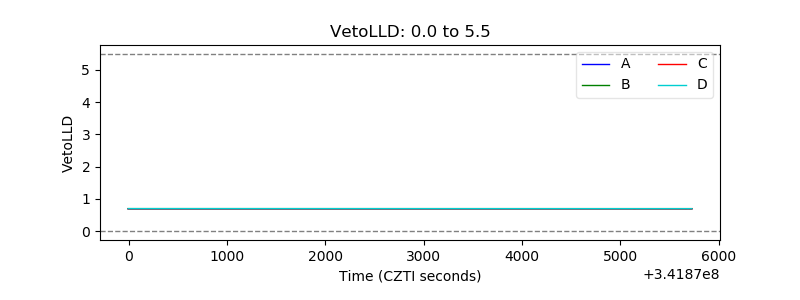 |
| Alpha Counter |  |
| _CPM_Rate |  |
| CZT Counter |  |
| +2.5 Volts monitor | 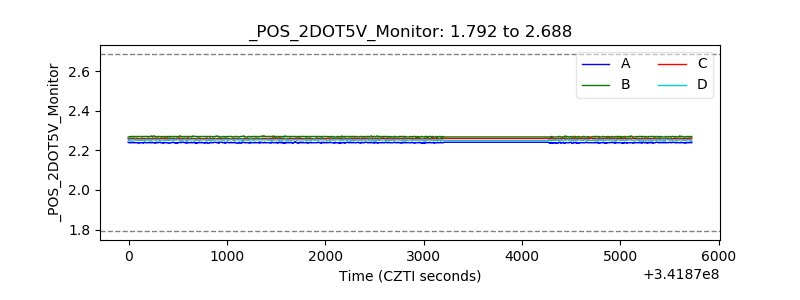 |
| +5 Volts monitor |  |
| _ROLL_ROT |  |
| _Roll_DEC |  |
| _Roll_RA | 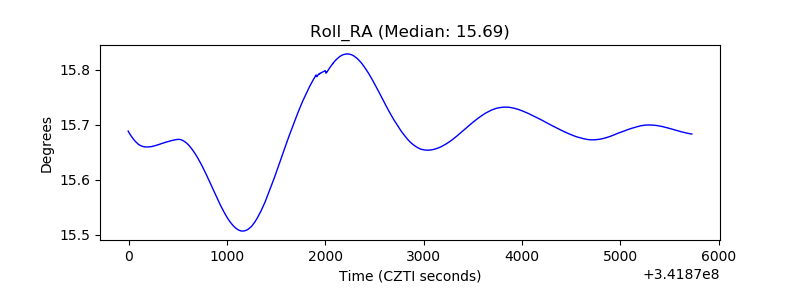 |
| Veto Counter |  |