| Param | Original file | Final file |
|---|---|---|
| Filename | modeM0/AS1A09_038T26_9000003948cztM0_level2_bc.evt | modeM0/AS1A09_038T26_9000003948cztM0_level2_quad_clean.evt |
| Size (bytes) | 126,912,960 | 46,172,160 |
| Size | 121.0 MB | 44.0 MB |
| Events in quadrant A | 634,734 | 303,512 |
| Events in quadrant B | 714,699 | 309,476 |
| Events in quadrant C | 926,921 | 292,199 |
| Events in quadrant D | 1,351,653 | 275,668 |
| Mode M0 | |||
|---|---|---|---|
| Quadrant | BADHDUFLAG | Total packets | Discarded packets |
| A | 0 | 6300 | 0 |
| B | 0 | 6598 | 0 |
| C | 0 | 7464 | 0 |
| D | 0 | 9192 | 0 |
| Mode SS | |||
|---|---|---|---|
| Quadrant | BADHDUFLAG | Total packets | Discarded packets |
| A | 0 | 60 | 0 |
| B | 0 | 60 | 0 |
| C | 0 | 60 | 0 |
| D | 0 | 60 | 0 |
| Mode M9 | |||
|---|---|---|---|
| Quadrant | BADHDUFLAG | Total packets | Discarded packets |
| A | 0 | 10 | 0 |
| B | 0 | 10 | 0 |
| C | 0 | 10 | 0 |
| D | 0 | 10 | 0 |
| Quadrant | Total seconds | Saturated seconds | Saturation percentage |
|---|---|---|---|
| A | 3056 | 20 | 0.654450% |
| B | 3056 | 39 | 1.276178% |
| C | 3056 | 93 | 3.043194% |
| D | 3056 | 238 | 7.787958% |
Noise dominated data is calculated using 1-second bins in cleaned event files. If a bin has >2000 counts, and if more than 50% of those come from <1% of pixels, then it is considered to be noise-dominated and hence unusable.
| Quadrant | # 1 sec bins | Bins with >0 counts | Bins with >2000 counts | High rate bins dominated by noise | Noise dominated (total time) | Noise dominated (detector-on time) | Marked lightcurve |
|---|---|---|---|---|---|---|---|
| A | 3981 | 3055 | 0 | 0 | 0.00% | 0.00% |  |
| B | 3981 | 3055 | 1 | 1 | 0.03% | 0.03% |  |
| C | 3981 | 3055 | 1 | 1 | 0.03% | 0.03% |  |
| D | 3981 | 3056 | 33 | 33 | 0.83% | 1.08% | 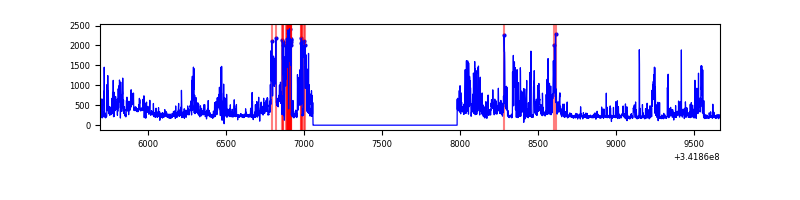 |
Top three noisy pixels from each quadrant. If the there are fewer than three noisy pixels in the level2.evt file, extra rows are filled as -1
| Pixel properties | Quadrant properties | ||||||
|---|---|---|---|---|---|---|---|
| Quadrant | DetID | PixID | Counts | Sigma | Mean | Median | Sigma |
| A | 13 | 254 | 5223 | 133.3 | 163 | 159 | 38.0 |
| A | 15 | 174 | 2102 | 51.15 | 163 | 159 | 38.0 |
| A | 13 | 170 | 1449 | 33.96 | 163 | 159 | 38.0 |
| B | 10 | 245 | 32914 | 955.63 | 165 | 160 | 34.3 |
| B | 0 | 230 | 23053 | 667.92 | 165 | 160 | 34.3 |
| B | 0 | 244 | 10321 | 296.45 | 165 | 160 | 34.3 |
| C | 7 | 221 | 281265 | 7114.96 | 156 | 154 | 39.5 |
| C | 2 | 16 | 42048 | 1060.34 | 156 | 154 | 39.5 |
| C | 13 | 61 | 882 | 18.43 | 156 | 154 | 39.5 |
| D | 1 | 52 | 677253 | 17949.51 | 154 | 148 | 37.7 |
| D | 2 | 250 | 52128 | 1377.95 | 154 | 148 | 37.7 |
| D | 7 | 80 | 16913 | 444.43 | 154 | 148 | 37.7 |
Histogram calculated using DETX and DETY for each event in the final _common_clean file
| Quadrant A |  |
 |
Quadrant B |
|---|---|---|---|
| Quadrant D | 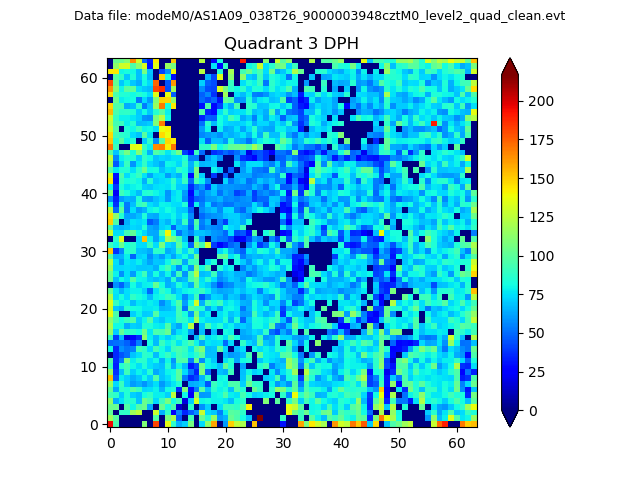 |
 |
Quadrant C |
| Plot type | Count rate plots | Images |
|---|---|---|
| Comparison with Poisson distribution Blue bars denote a histogram of data divided into 1 sec bins. Red curve is a Poisson curve with rate = median count rate of data. |
 |
 |
| Quadrant-wise count rates Data is divided into 100 sec bins |
 |
|
| Module-wise count rates for Quadrant A Data is divided into 100 sec bins |
 |
 |
| Module-wise count rates for Quadrant B Data is divided into 100 sec bins |
 |
 |
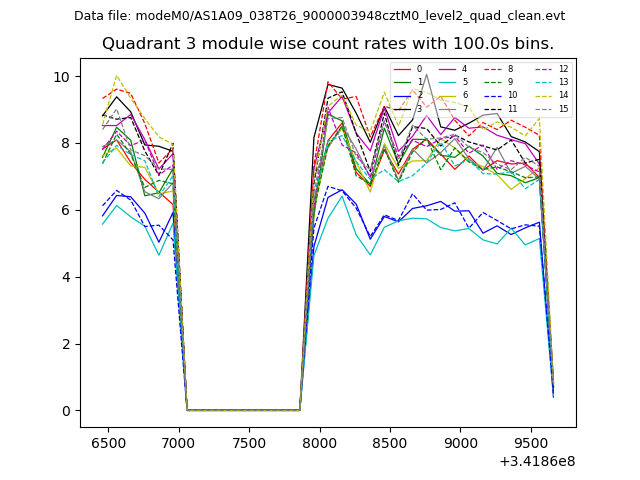
| Module-wise count rates for Quadrant C Data is divided into 100 sec bins |
 |
 |
| Module-wise count rates for Quadrant D Data is divided into 100 sec bins |
 |
 |
| Parameter | Plot |
|---|---|
| CZT HV Monitor |  |
| D_VDD |  |
| Temperature 1 |  |
| Veto HV Monitor |  |
| Veto LLD |  |
| Alpha Counter | 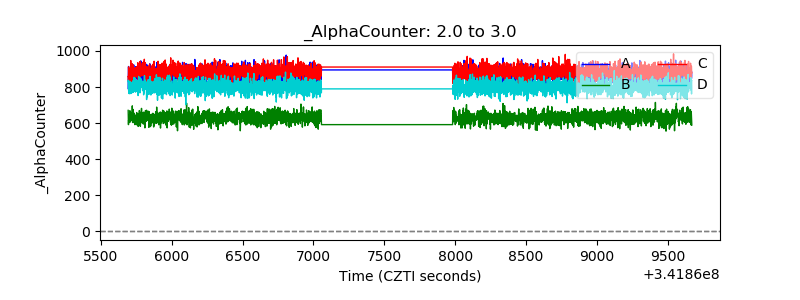 |
| _CPM_Rate |  |
| CZT Counter |  |
| +2.5 Volts monitor |  |
| +5 Volts monitor |  |
| _ROLL_ROT | 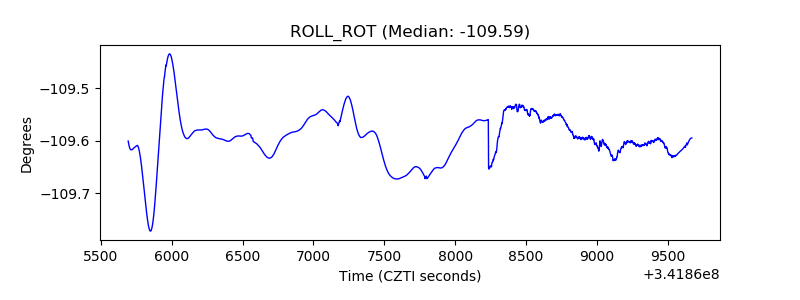 |
| _Roll_DEC |  |
| _Roll_RA |  |
| Veto Counter |  |