| Param | Original file | Final file |
|---|---|---|
| Filename | modeM0/AS1A09_038T25_9000003946cztM0_level2_bc.evt | modeM0/AS1A09_038T25_9000003946cztM0_level2_quad_clean.evt |
| Size (bytes) | 178,741,440 | 73,589,760 |
| Size | 170.5 MB | 70.2 MB |
| Events in quadrant A | 820,124 | 499,486 |
| Events in quadrant B | 913,950 | 507,526 |
| Events in quadrant C | 785,333 | 481,367 |
| Events in quadrant D | 2,597,576 | 441,902 |
| Mode SS | |||
|---|---|---|---|
| Quadrant | BADHDUFLAG | Total packets | Discarded packets |
| A | 0 | 86 | 0 |
| B | 0 | 86 | 0 |
| C | 0 | 86 | 0 |
| D | 0 | 86 | 0 |
| Mode M0 | |||
|---|---|---|---|
| Quadrant | BADHDUFLAG | Total packets | Discarded packets |
| A | 0 | 8616 | 0 |
| B | 0 | 8873 | 0 |
| C | 0 | 8609 | 0 |
| D | 0 | 15625 | 0 |
| Mode M9 | |||
|---|---|---|---|
| Quadrant | BADHDUFLAG | Total packets | Discarded packets |
| A | 0 | 7 | 0 |
| B | 0 | 7 | 0 |
| C | 0 | 7 | 0 |
| D | 0 | 7 | 0 |
| Quadrant | Total seconds | Saturated seconds | Saturation percentage |
|---|---|---|---|
| A | 4233 | 28 | 0.661469% |
| B | 4233 | 42 | 0.992204% |
| C | 4233 | 36 | 0.850461% |
| D | 4233 | 603 | 14.245216% |
Noise dominated data is calculated using 1-second bins in cleaned event files. If a bin has >2000 counts, and if more than 50% of those come from <1% of pixels, then it is considered to be noise-dominated and hence unusable.
| Quadrant | # 1 sec bins | Bins with >0 counts | Bins with >2000 counts | High rate bins dominated by noise | Noise dominated (total time) | Noise dominated (detector-on time) | Marked lightcurve |
|---|---|---|---|---|---|---|---|
| A | 4973 | 4232 | 0 | 0 | 0.00% | 0.00% |  |
| B | 4973 | 4232 | 1 | 1 | 0.02% | 0.02% |  |
| C | 4973 | 4232 | 0 | 0 | 0.00% | 0.00% |  |
| D | 4973 | 4232 | 65 | 65 | 1.31% | 1.54% |  |
Top three noisy pixels from each quadrant. If the there are fewer than three noisy pixels in the level2.evt file, extra rows are filled as -1
| Pixel properties | Quadrant properties | ||||||
|---|---|---|---|---|---|---|---|
| Quadrant | DetID | PixID | Counts | Sigma | Mean | Median | Sigma |
| A | 13 | 254 | 7168 | 142.86 | 210 | 205 | 48.7 |
| A | 6 | 16 | 3069 | 58.76 | 210 | 205 | 48.7 |
| A | 7 | 16 | 1386 | 24.23 | 210 | 205 | 48.7 |
| B | 10 | 245 | 37225 | 844.86 | 212 | 207 | 43.8 |
| B | 0 | 230 | 28195 | 638.77 | 212 | 207 | 43.8 |
| B | 15 | 32 | 11027 | 246.94 | 212 | 207 | 43.8 |
| C | 7 | 221 | 9150 | 177.59 | 201 | 199 | 50.4 |
| C | 2 | 16 | 3195 | 59.44 | 201 | 199 | 50.4 |
| C | 13 | 61 | 1127 | 18.41 | 201 | 199 | 50.4 |
| D | 1 | 52 | 1740383 | 36322.79 | 193 | 186 | 47.9 |
| D | 7 | 80 | 48892 | 1016.63 | 193 | 186 | 47.9 |
| D | 2 | 250 | 31418 | 651.9 | 193 | 186 | 47.9 |
Histogram calculated using DETX and DETY for each event in the final _common_clean file
| Quadrant A | 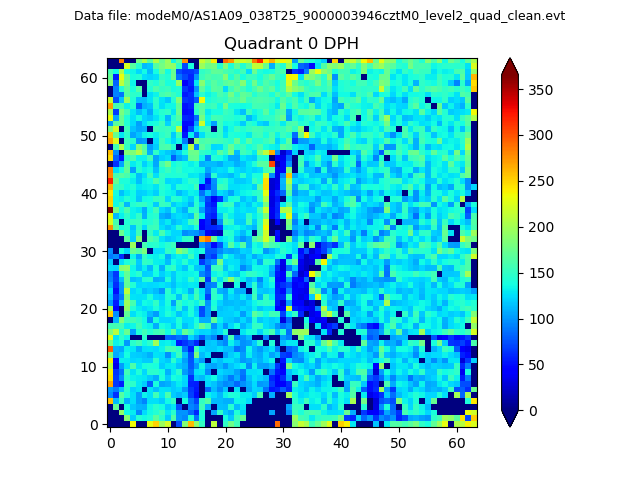 |
 |
Quadrant B |
|---|---|---|---|
| Quadrant D |  |
 |
Quadrant C |
| Plot type | Count rate plots | Images |
|---|---|---|
| Comparison with Poisson distribution Blue bars denote a histogram of data divided into 1 sec bins. Red curve is a Poisson curve with rate = median count rate of data. |
 |
 |
| Quadrant-wise count rates Data is divided into 100 sec bins |
 |
|
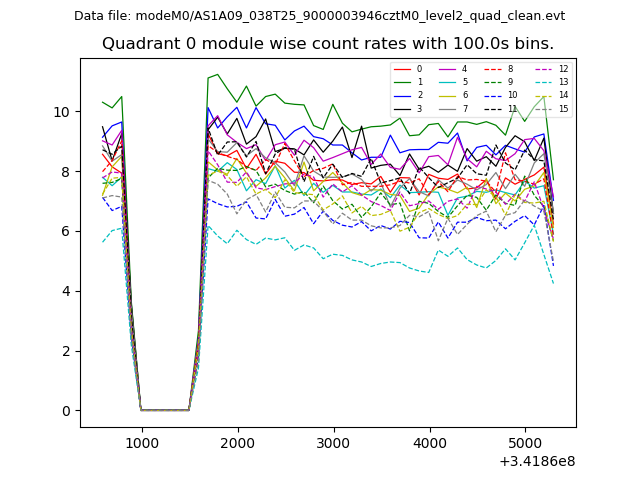
| Module-wise count rates for Quadrant A Data is divided into 100 sec bins |
 |
 |
| Module-wise count rates for Quadrant B Data is divided into 100 sec bins |
 |
 |
| Module-wise count rates for Quadrant C Data is divided into 100 sec bins |
 |
 |
| Module-wise count rates for Quadrant D Data is divided into 100 sec bins |
 |
 |
| Parameter | Plot |
|---|---|
| CZT HV Monitor |  |
| D_VDD |  |
| Temperature 1 |  |
| Veto HV Monitor |  |
| Veto LLD |  |
| Alpha Counter |  |
| _CPM_Rate |  |
| CZT Counter |  |
| +2.5 Volts monitor |  |
| +5 Volts monitor |  |
| _ROLL_ROT |  |
| _Roll_DEC |  |
| _Roll_RA |  |
| Veto Counter |  |