| Param | Original file | Final file |
|---|---|---|
| Filename | modeM0/AS1A09_038T23_9000003944cztM0_level2_bc.evt | modeM0/AS1A09_038T23_9000003944cztM0_level2_quad_clean.evt |
| Size (bytes) | 173,839,680 | 82,097,280 |
| Size | 165.8 MB | 78.3 MB |
| Events in quadrant A | 1,084,354 | 537,867 |
| Events in quadrant B | 1,320,491 | 541,095 |
| Events in quadrant C | 1,062,836 | 519,940 |
| Events in quadrant D | 1,419,357 | 507,549 |
| Mode SS | |||
|---|---|---|---|
| Quadrant | BADHDUFLAG | Total packets | Discarded packets |
| A | 0 | 110 | 0 |
| B | 0 | 110 | 0 |
| C | 0 | 110 | 0 |
| D | 0 | 110 | 0 |
| Mode M9 | |||
|---|---|---|---|
| Quadrant | BADHDUFLAG | Total packets | Discarded packets |
| A | 0 | 5 | 0 |
| B | 0 | 5 | 0 |
| C | 0 | 5 | 0 |
| D | 0 | 5 | 0 |
| Mode M0 | |||
|---|---|---|---|
| Quadrant | BADHDUFLAG | Total packets | Discarded packets |
| A | 0 | 11140 | 0 |
| B | 0 | 11949 | 0 |
| C | 0 | 11299 | 0 |
| D | 0 | 12135 | 0 |
| Quadrant | Total seconds | Saturated seconds | Saturation percentage |
|---|---|---|---|
| A | 5426 | 68 | 1.253225% |
| B | 5426 | 114 | 2.100995% |
| C | 5426 | 80 | 1.474383% |
| D | 5426 | 108 | 1.990417% |
Noise dominated data is calculated using 1-second bins in cleaned event files. If a bin has >2000 counts, and if more than 50% of those come from <1% of pixels, then it is considered to be noise-dominated and hence unusable.
| Quadrant | # 1 sec bins | Bins with >0 counts | Bins with >2000 counts | High rate bins dominated by noise | Noise dominated (total time) | Noise dominated (detector-on time) | Marked lightcurve |
|---|---|---|---|---|---|---|---|
| A | 5956 | 5425 | 0 | 0 | 0.00% | 0.00% | 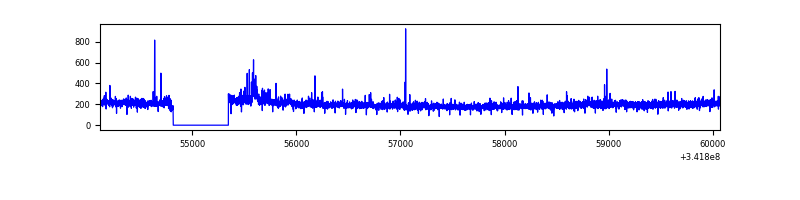 |
| B | 5955 | 5424 | 1 | 1 | 0.02% | 0.02% |  |
| C | 5956 | 5425 | 1 | 1 | 0.02% | 0.02% |  |
| D | 5956 | 5426 | 35 | 35 | 0.59% | 0.65% |  |
Top three noisy pixels from each quadrant. If the there are fewer than three noisy pixels in the level2.evt file, extra rows are filled as -1
| Pixel properties | Quadrant properties | ||||||
|---|---|---|---|---|---|---|---|
| Quadrant | DetID | PixID | Counts | Sigma | Mean | Median | Sigma |
| A | 0 | 13 | 13510 | 212.6 | 270 | 263 | 62.3 |
| A | 4 | 2 | 11471 | 179.88 | 270 | 263 | 62.3 |
| A | 13 | 254 | 9372 | 146.19 | 270 | 263 | 62.3 |
| B | 10 | 245 | 193209 | 3544.73 | 271 | 264 | 54.4 |
| B | 0 | 230 | 28292 | 514.92 | 271 | 264 | 54.4 |
| B | 4 | 200 | 20061 | 363.71 | 271 | 264 | 54.4 |
| C | 7 | 221 | 46938 | 732.25 | 260 | 258 | 63.7 |
| C | 2 | 16 | 15204 | 234.45 | 260 | 258 | 63.7 |
| C | 13 | 61 | 1425 | 18.31 | 260 | 258 | 63.7 |
| D | 1 | 52 | 257625 | 4048.29 | 263 | 253 | 63.6 |
| D | 2 | 250 | 60632 | 949.72 | 263 | 253 | 63.6 |
| D | 7 | 80 | 60093 | 941.24 | 263 | 253 | 63.6 |
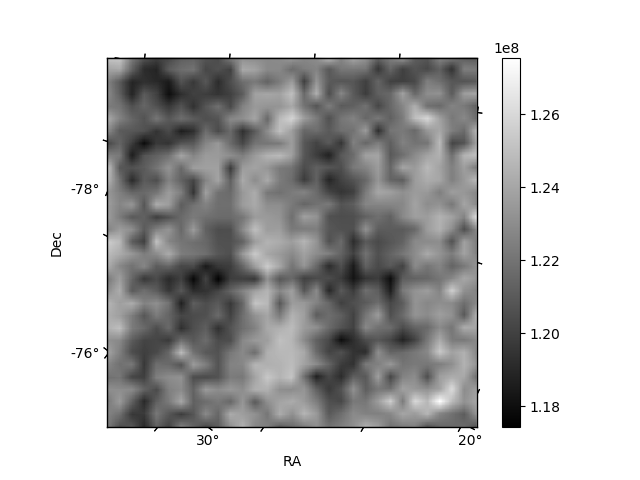
Histogram calculated using DETX and DETY for each event in the final _common_clean file
| Quadrant A |  |
 |
Quadrant B |
|---|---|---|---|
| Quadrant D |  |
 |
Quadrant C |
| Plot type | Count rate plots | Images |
|---|---|---|
| Comparison with Poisson distribution Blue bars denote a histogram of data divided into 1 sec bins. Red curve is a Poisson curve with rate = median count rate of data. |
 |
 |
| Quadrant-wise count rates Data is divided into 100 sec bins |
 |
|
| Module-wise count rates for Quadrant A Data is divided into 100 sec bins |
 |
 |
| Module-wise count rates for Quadrant B Data is divided into 100 sec bins |
 |
 |
| Module-wise count rates for Quadrant C Data is divided into 100 sec bins |
 |
 |
| Module-wise count rates for Quadrant D Data is divided into 100 sec bins |
 |
 |
| Parameter | Plot |
|---|---|
| CZT HV Monitor |  |
| D_VDD |  |
| Temperature 1 |  |
| Veto HV Monitor |  |
| Veto LLD |  |
| Alpha Counter |  |
| _CPM_Rate |  |
| CZT Counter |  |
| +2.5 Volts monitor |  |
| +5 Volts monitor |  |
| _ROLL_ROT |  |
| _Roll_DEC |  |
| _Roll_RA |  |
| Veto Counter |  |