| Param | Original file | Final file |
|---|---|---|
| Filename | modeM0/AS1A09_038T20_9000003940cztM0_level2_bc.evt | modeM0/AS1A09_038T20_9000003940cztM0_level2_quad_clean.evt |
| Size (bytes) | 215,830,080 | 89,640,000 |
| Size | 205.8 MB | 85.5 MB |
| Events in quadrant A | 1,294,866 | 588,296 |
| Events in quadrant B | 1,306,097 | 596,846 |
| Events in quadrant C | 1,331,302 | 571,186 |
| Events in quadrant D | 2,191,283 | 543,411 |
| Mode M0 | |||
|---|---|---|---|
| Quadrant | BADHDUFLAG | Total packets | Discarded packets |
| A | 0 | 12310 | 0 |
| B | 0 | 12552 | 0 |
| C | 0 | 12903 | 0 |
| D | 0 | 15907 | 0 |
| Mode SS | |||
|---|---|---|---|
| Quadrant | BADHDUFLAG | Total packets | Discarded packets |
| A | 0 | 118 | 0 |
| B | 0 | 118 | 0 |
| C | 0 | 118 | 0 |
| D | 0 | 118 | 0 |
| Quadrant | Total seconds | Saturated seconds | Saturation percentage |
|---|---|---|---|
| A | 5942 | 148 | 2.490744% |
| B | 5942 | 182 | 3.062942% |
| C | 5942 | 232 | 3.904409% |
| D | 5942 | 461 | 7.758331% |
Noise dominated data is calculated using 1-second bins in cleaned event files. If a bin has >2000 counts, and if more than 50% of those come from <1% of pixels, then it is considered to be noise-dominated and hence unusable.
| Quadrant | # 1 sec bins | Bins with >0 counts | Bins with >2000 counts | High rate bins dominated by noise | Noise dominated (total time) | Noise dominated (detector-on time) | Marked lightcurve |
|---|---|---|---|---|---|---|---|
| A | 5962 | 5943 | 2 | 2 | 0.03% | 0.03% |  |
| B | 5962 | 5941 | 0 | 0 | 0.00% | 0.00% |  |
| C | 5962 | 5943 | 1 | 1 | 0.02% | 0.02% |  |
| D | 5962 | 5943 | 39 | 39 | 0.65% | 0.66% |  |
Top three noisy pixels from each quadrant. If the there are fewer than three noisy pixels in the level2.evt file, extra rows are filled as -1
| Pixel properties | Quadrant properties | ||||||
|---|---|---|---|---|---|---|---|
| Quadrant | DetID | PixID | Counts | Sigma | Mean | Median | Sigma |
| A | 0 | 13 | 110040 | 1604.26 | 299 | 293 | 68.4 |
| A | 14 | 235 | 13897 | 198.86 | 299 | 293 | 68.4 |
| A | 6 | 16 | 11211 | 159.6 | 299 | 293 | 68.4 |
| B | 10 | 245 | 50870 | 828.73 | 302 | 295 | 61.0 |
| B | 0 | 244 | 27093 | 439.12 | 302 | 295 | 61.0 |
| B | 0 | 230 | 20946 | 338.39 | 302 | 295 | 61.0 |
| C | 7 | 221 | 216541 | 3062.43 | 288 | 284 | 70.6 |
| C | 2 | 16 | 4075 | 53.68 | 288 | 284 | 70.6 |
| C | 10 | 22 | 2157 | 26.52 | 288 | 284 | 70.6 |
| D | 1 | 52 | 933526 | 13684.86 | 287 | 276 | 68.2 |
| D | 7 | 80 | 46715 | 680.97 | 287 | 276 | 68.2 |
| D | 2 | 250 | 43228 | 629.83 | 287 | 276 | 68.2 |
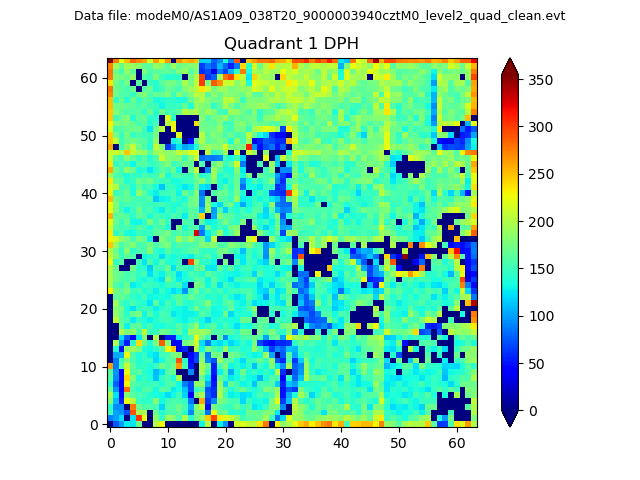
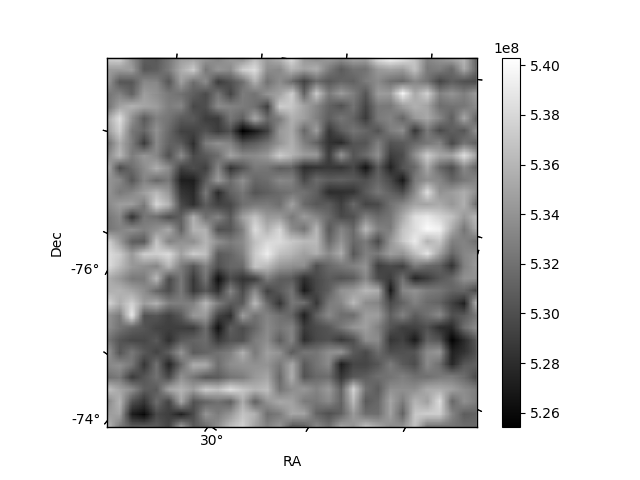
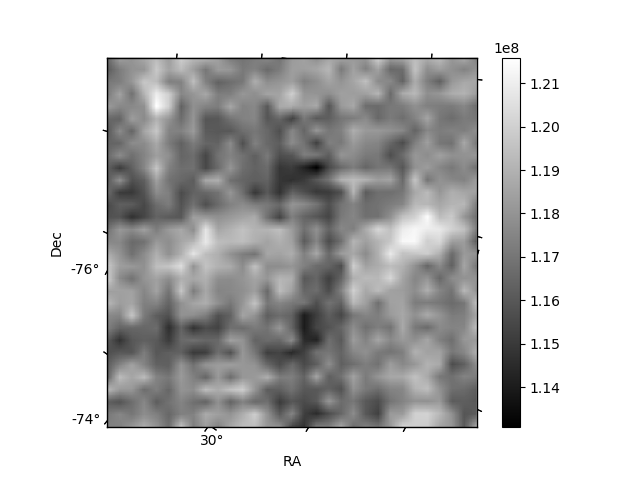
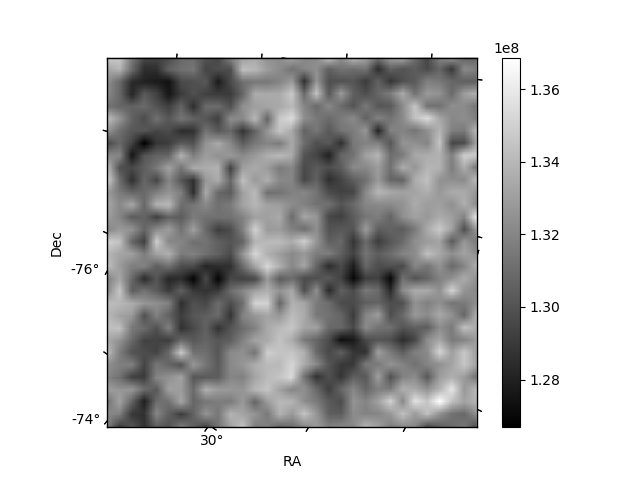
Histogram calculated using DETX and DETY for each event in the final _common_clean file
| Quadrant A |  |
 |
Quadrant B |
|---|---|---|---|
| Quadrant D | 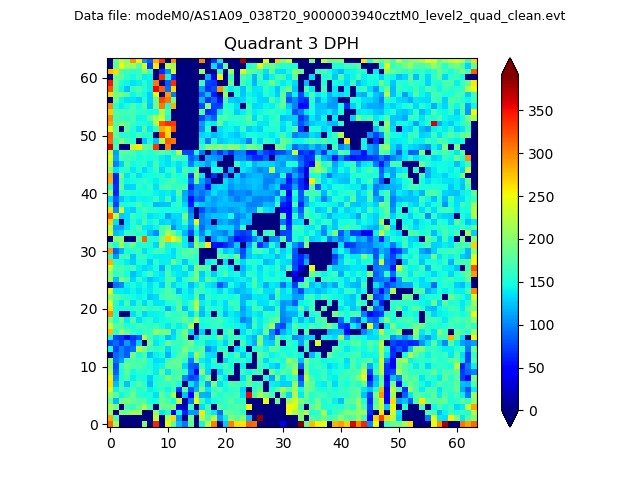 |
 |
Quadrant C |
| Plot type | Count rate plots | Images |
|---|---|---|
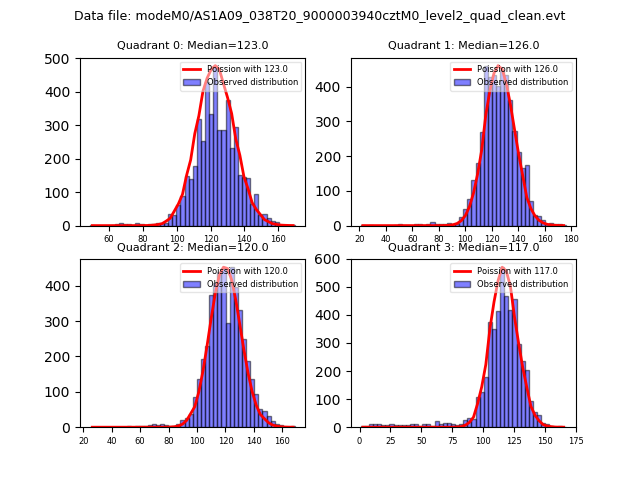
| Comparison with Poisson distribution Blue bars denote a histogram of data divided into 1 sec bins. Red curve is a Poisson curve with rate = median count rate of data. |
 |
 |
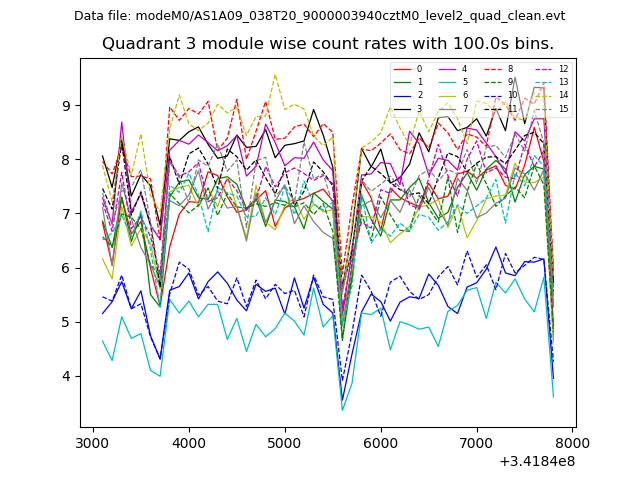
| Quadrant-wise count rates Data is divided into 100 sec bins |
 |
|
| Module-wise count rates for Quadrant A Data is divided into 100 sec bins |
 |
 |
| Module-wise count rates for Quadrant B Data is divided into 100 sec bins |
 |
 |
| Module-wise count rates for Quadrant C Data is divided into 100 sec bins |
 |
 |
| Module-wise count rates for Quadrant D Data is divided into 100 sec bins |
 |
 |
| Parameter | Plot |
|---|---|
| CZT HV Monitor |  |
| D_VDD |  |
| Temperature 1 | 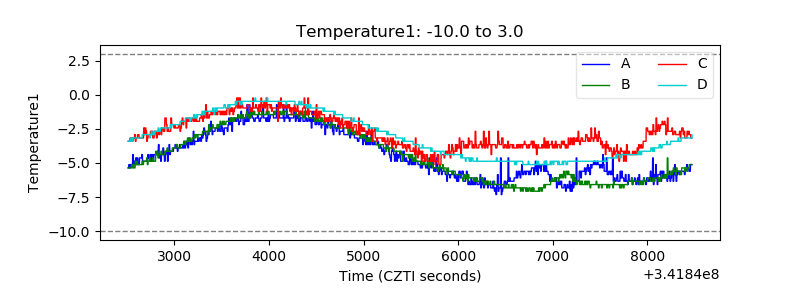 |
| Veto HV Monitor |  |
| Veto LLD |  |
| Alpha Counter |  |
| _CPM_Rate |  |
| CZT Counter |  |
| +2.5 Volts monitor |  |
| +5 Volts monitor |  |
| _ROLL_ROT |  |
| _Roll_DEC |  |
| _Roll_RA |  |
| Veto Counter |  |