| Param | Original file | Final file |
|---|---|---|
| Filename | modeM0/AS1A09_038T15_9000003936cztM0_level2_bc.evt | modeM0/AS1A09_038T15_9000003936cztM0_level2_quad_clean.evt |
| Size (bytes) | 250,672,320 | 86,397,120 |
| Size | 239.1 MB | 82.4 MB |
| Events in quadrant A | 1,256,794 | 572,415 |
| Events in quadrant B | 1,374,026 | 581,849 |
| Events in quadrant C | 1,261,689 | 554,917 |
| Events in quadrant D | 3,302,749 | 507,988 |
| Mode SS | |||
|---|---|---|---|
| Quadrant | BADHDUFLAG | Total packets | Discarded packets |
| A | 0 | 114 | 0 |
| B | 0 | 114 | 0 |
| C | 0 | 114 | 0 |
| D | 0 | 114 | 0 |
| Mode M0 | |||
|---|---|---|---|
| Quadrant | BADHDUFLAG | Total packets | Discarded packets |
| A | 0 | 11679 | 0 |
| B | 0 | 12243 | 0 |
| C | 0 | 12265 | 0 |
| D | 0 | 19496 | 0 |
| Mode M9 | |||
|---|---|---|---|
| Quadrant | BADHDUFLAG | Total packets | Discarded packets |
| A | 0 | 4 | 0 |
| B | 0 | 4 | 0 |
| C | 0 | 4 | 0 |
| D | 0 | 4 | 0 |
| Quadrant | Total seconds | Saturated seconds | Saturation percentage |
|---|---|---|---|
| A | 5708 | 29 | 0.508059% |
| B | 5708 | 72 | 1.261388% |
| C | 5708 | 114 | 1.997197% |
| D | 5708 | 753 | 13.192011% |
Noise dominated data is calculated using 1-second bins in cleaned event files. If a bin has >2000 counts, and if more than 50% of those come from <1% of pixels, then it is considered to be noise-dominated and hence unusable.
| Quadrant | # 1 sec bins | Bins with >0 counts | Bins with >2000 counts | High rate bins dominated by noise | Noise dominated (total time) | Noise dominated (detector-on time) | Marked lightcurve |
|---|---|---|---|---|---|---|---|
| A | 5707 | 5707 | 3 | 3 | 0.05% | 0.05% |  |
| B | 5707 | 5707 | 1 | 1 | 0.02% | 0.02% |  |
| C | 5707 | 5707 | 3 | 3 | 0.05% | 0.05% | 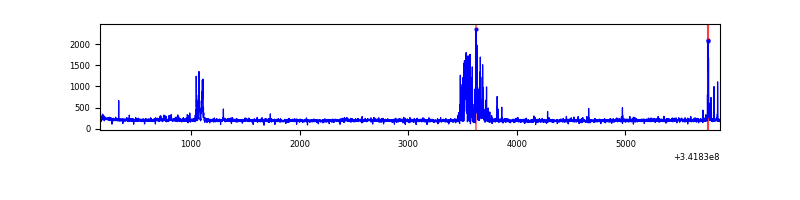 |
| D | 5707 | 5707 | 197 | 197 | 3.45% | 3.45% |  |
Top three noisy pixels from each quadrant. If the there are fewer than three noisy pixels in the level2.evt file, extra rows are filled as -1
| Pixel properties | Quadrant properties | ||||||
|---|---|---|---|---|---|---|---|
| Quadrant | DetID | PixID | Counts | Sigma | Mean | Median | Sigma |
| A | 0 | 13 | 96885 | 1478.31 | 291 | 285 | 65.3 |
| A | 6 | 16 | 21737 | 328.29 | 291 | 285 | 65.3 |
| A | 0 | 31 | 9279 | 137.64 | 291 | 285 | 65.3 |
| B | 10 | 245 | 133254 | 2269.87 | 294 | 288 | 58.6 |
| B | 0 | 230 | 60596 | 1029.52 | 294 | 288 | 58.6 |
| B | 15 | 33 | 20703 | 348.51 | 294 | 288 | 58.6 |
| C | 2 | 16 | 162449 | 2354.44 | 281 | 279 | 68.9 |
| C | 1 | 16 | 9661 | 136.21 | 281 | 279 | 68.9 |
| C | 7 | 221 | 9277 | 130.64 | 281 | 279 | 68.9 |
| D | 1 | 52 | 1620399 | 25258.22 | 267 | 257 | 64.1 |
| D | 7 | 80 | 402991 | 6278.68 | 267 | 257 | 64.1 |
| D | 12 | 227 | 112829 | 1755.01 | 267 | 257 | 64.1 |
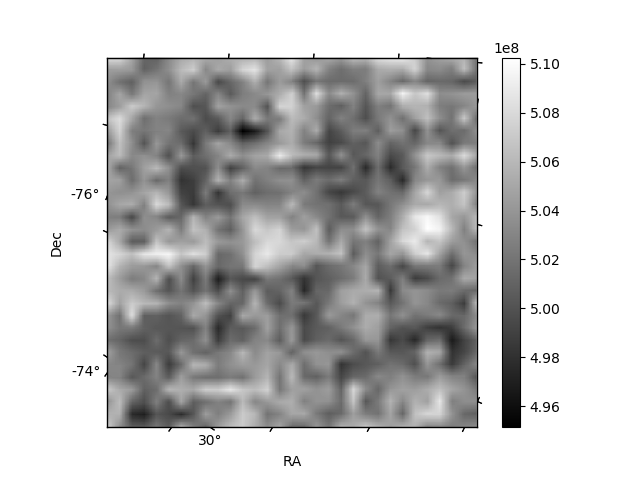
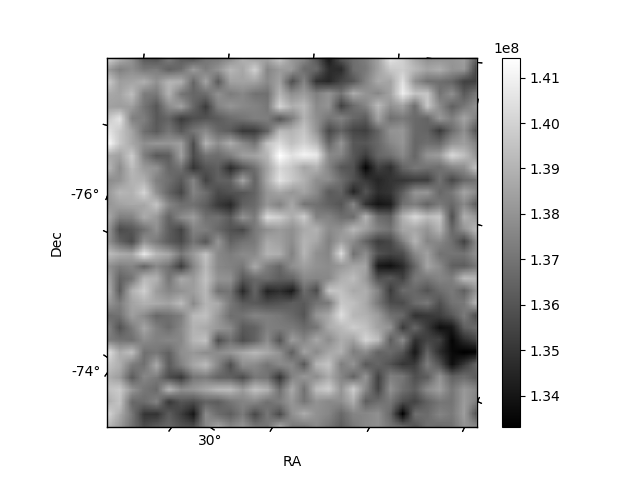
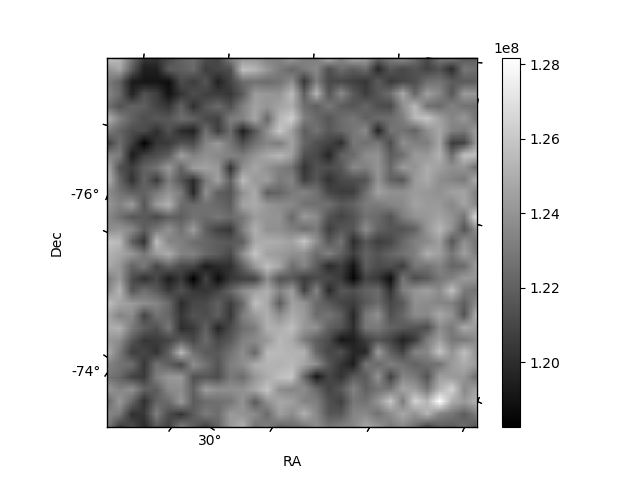
Histogram calculated using DETX and DETY for each event in the final _common_clean file
| Quadrant A |  |
 |
Quadrant B |
|---|---|---|---|
| Quadrant D |  |
 |
Quadrant C |
| Plot type | Count rate plots | Images |
|---|---|---|
| Comparison with Poisson distribution Blue bars denote a histogram of data divided into 1 sec bins. Red curve is a Poisson curve with rate = median count rate of data. |
 |
 |
| Quadrant-wise count rates Data is divided into 100 sec bins |
 |
|
| Module-wise count rates for Quadrant A Data is divided into 100 sec bins |
 |
 |
| Module-wise count rates for Quadrant B Data is divided into 100 sec bins |
 |
 |
| Module-wise count rates for Quadrant C Data is divided into 100 sec bins |
 |
 |
| Module-wise count rates for Quadrant D Data is divided into 100 sec bins |
 |
 |
| Parameter | Plot |
|---|---|
| CZT HV Monitor | 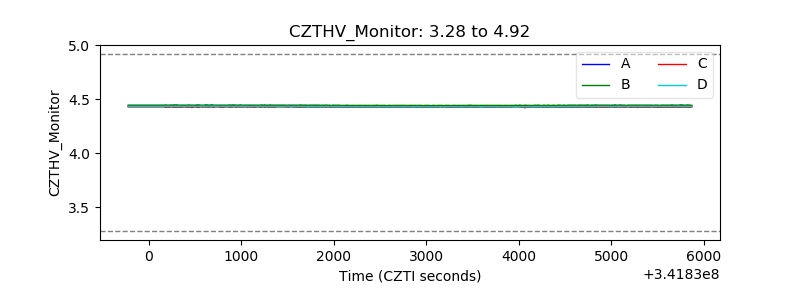 |
| D_VDD | 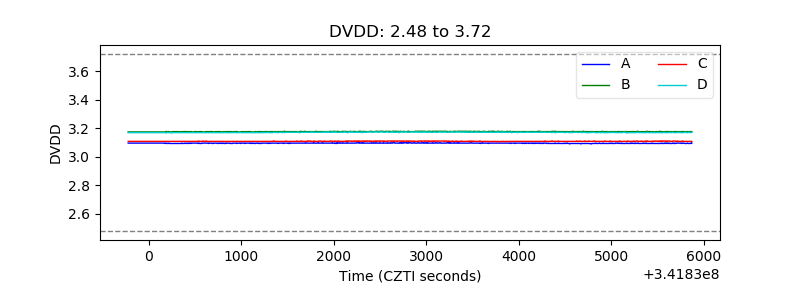 |
| Temperature 1 |  |
| Veto HV Monitor |  |
| Veto LLD |  |
| Alpha Counter | 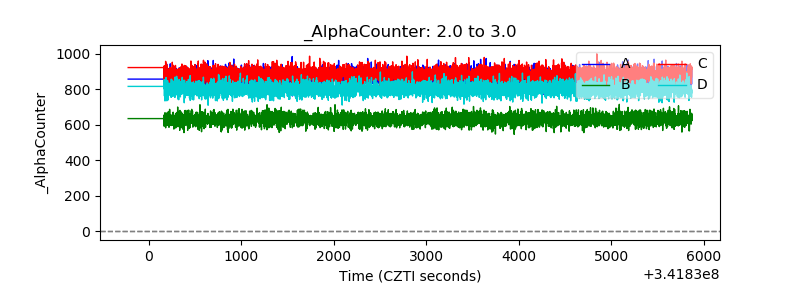 |
| _CPM_Rate | 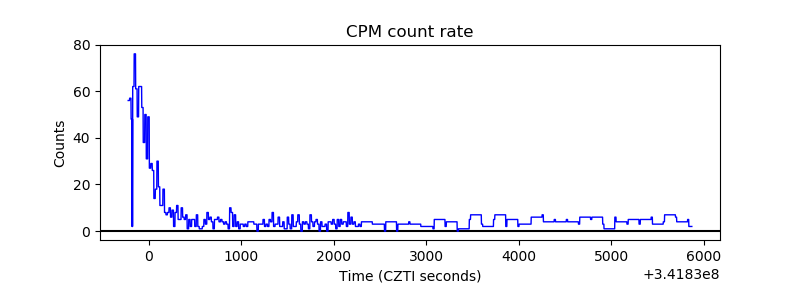 |
| CZT Counter | 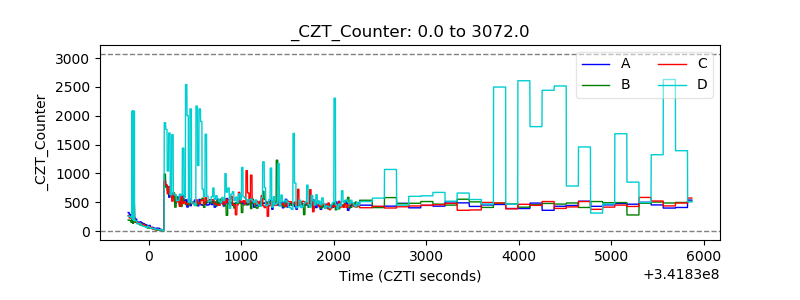 |
| +2.5 Volts monitor |  |
| +5 Volts monitor |  |
| _ROLL_ROT |  |
| _Roll_DEC |  |
| _Roll_RA | 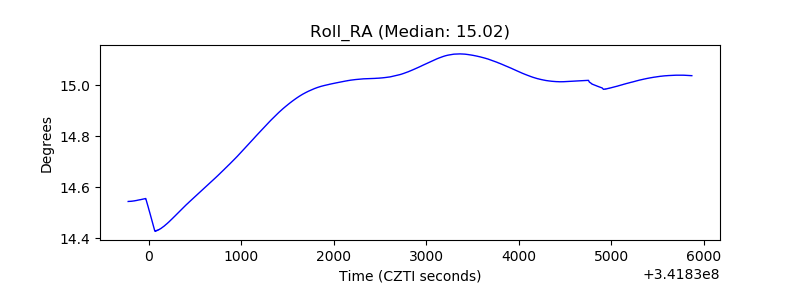 |
| Veto Counter |  |