| Param | Original file | Final file |
|---|---|---|
| Filename | modeM0/AS1T03_249T01_9000003934cztM0_level2_bc.evt | modeM0/AS1T03_249T01_9000003934cztM0_level2_quad_clean.evt |
| Size (bytes) | 823,118,400 | 257,869,440 |
| Size | 785.0 MB | 245.9 MB |
| Events in quadrant A | 4,556,351 | 1,664,347 |
| Events in quadrant B | 5,985,361 | 1,677,166 |
| Events in quadrant C | 4,252,707 | 1,594,624 |
| Events in quadrant D | 8,796,277 | 1,527,245 |
| Mode M0 | |||
|---|---|---|---|
| Quadrant | BADHDUFLAG | Total packets | Discarded packets |
| A | 0 | 41263 | 0 |
| B | 0 | 47514 | 0 |
| C | 0 | 41346 | 0 |
| D | 0 | 57714 | 0 |
| Mode SS | |||
|---|---|---|---|
| Quadrant | BADHDUFLAG | Total packets | Discarded packets |
| A | 0 | 398 | 0 |
| B | 0 | 398 | 0 |
| C | 0 | 398 | 0 |
| D | 0 | 398 | 0 |
| Mode M9 | |||
|---|---|---|---|
| Quadrant | BADHDUFLAG | Total packets | Discarded packets |
| A | 0 | 41 | 0 |
| B | 0 | 42 | 0 |
| C | 0 | 42 | 0 |
| D | 0 | 42 | 0 |
| Quadrant | Total seconds | Saturated seconds | Saturation percentage |
|---|---|---|---|
| A | 19549 | 140 | 0.716149% |
| B | 19549 | 629 | 3.217556% |
| C | 19549 | 250 | 1.278838% |
| D | 19549 | 1504 | 7.693488% |
Noise dominated data is calculated using 1-second bins in cleaned event files. If a bin has >2000 counts, and if more than 50% of those come from <1% of pixels, then it is considered to be noise-dominated and hence unusable.
| Quadrant | # 1 sec bins | Bins with >0 counts | Bins with >2000 counts | High rate bins dominated by noise | Noise dominated (total time) | Noise dominated (detector-on time) | Marked lightcurve |
|---|---|---|---|---|---|---|---|
| A | 23313 | 19546 | 18 | 18 | 0.08% | 0.09% |  |
| B | 23313 | 19546 | 33 | 33 | 0.14% | 0.17% |  |
| C | 23313 | 19545 | 0 | 0 | 0.00% | 0.00% |  |
| D | 23312 | 19547 | 335 | 335 | 1.44% | 1.71% | 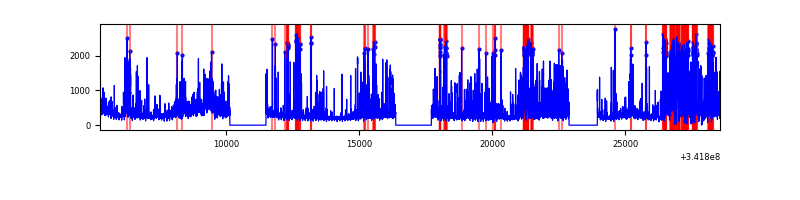 |
Top three noisy pixels from each quadrant. If the there are fewer than three noisy pixels in the level2.evt file, extra rows are filled as -1
| Pixel properties | Quadrant properties | ||||||
|---|---|---|---|---|---|---|---|
| Quadrant | DetID | PixID | Counts | Sigma | Mean | Median | Sigma |
| A | 6 | 16 | 96429 | 394.01 | 1144 | 1126 | 241.9 |
| A | 0 | 13 | 43221 | 174.03 | 1144 | 1126 | 241.9 |
| A | 13 | 254 | 30046 | 119.56 | 1144 | 1126 | 241.9 |
| B | 10 | 245 | 1367745 | 6390.14 | 1147 | 1122 | 213.9 |
| B | 0 | 230 | 66405 | 305.25 | 1147 | 1122 | 213.9 |
| B | 15 | 32 | 45965 | 209.68 | 1147 | 1122 | 213.9 |
| C | 2 | 16 | 25675 | 96.72 | 1089 | 1086 | 254.2 |
| C | 1 | 16 | 22170 | 82.94 | 1089 | 1086 | 254.2 |
| C | 7 | 221 | 20460 | 76.21 | 1089 | 1086 | 254.2 |
| D | 1 | 52 | 2706115 | 11409.46 | 1064 | 1031 | 237.1 |
| D | 7 | 80 | 1052480 | 4434.78 | 1064 | 1031 | 237.1 |
| D | 12 | 227 | 592151 | 2493.22 | 1064 | 1031 | 237.1 |
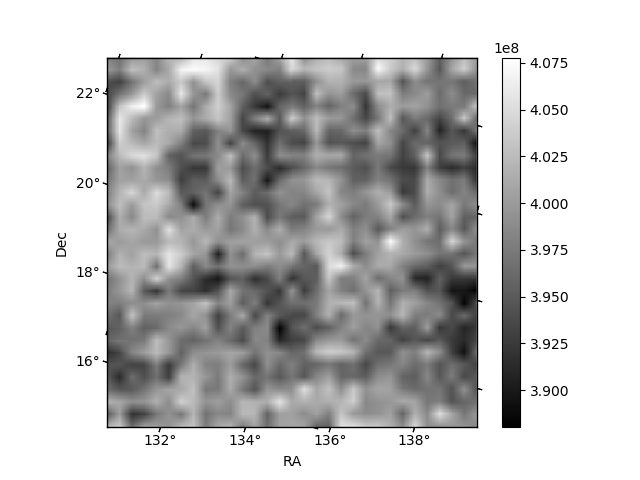
Histogram calculated using DETX and DETY for each event in the final _common_clean file
| Quadrant A |  |
 |
Quadrant B |
|---|---|---|---|
| Quadrant D |  |
 |
Quadrant C |
| Plot type | Count rate plots | Images |
|---|---|---|
| Comparison with Poisson distribution Blue bars denote a histogram of data divided into 1 sec bins. Red curve is a Poisson curve with rate = median count rate of data. |
 |
 |
| Quadrant-wise count rates Data is divided into 100 sec bins |
 |
|
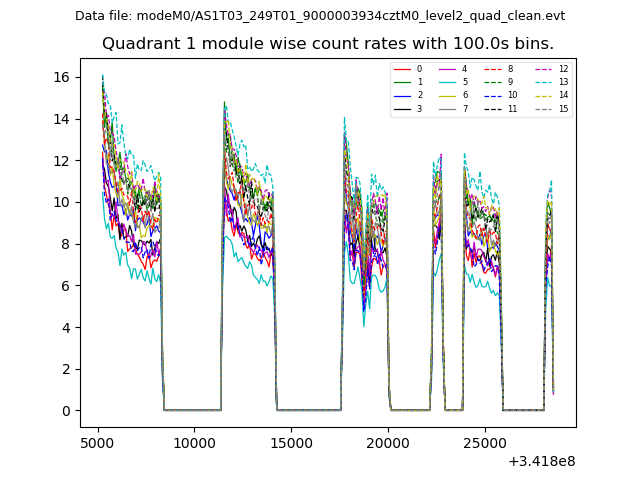
| Module-wise count rates for Quadrant A Data is divided into 100 sec bins |
 |
 |
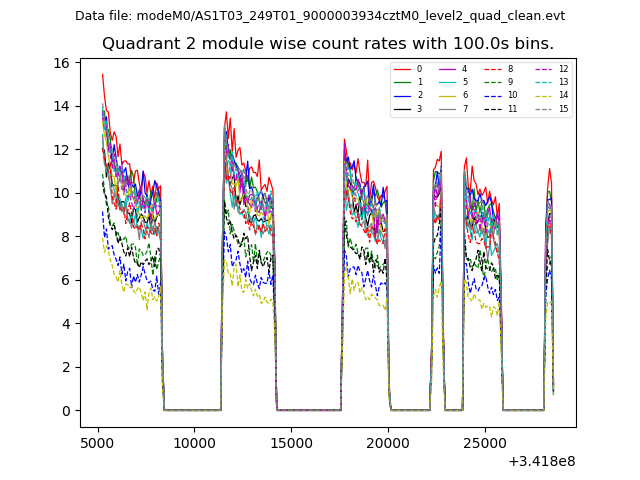
| Module-wise count rates for Quadrant B Data is divided into 100 sec bins |
 |
 |
| Module-wise count rates for Quadrant C Data is divided into 100 sec bins |
 |
 |
| Module-wise count rates for Quadrant D Data is divided into 100 sec bins |
 |
 |
| Parameter | Plot |
|---|---|
| CZT HV Monitor | 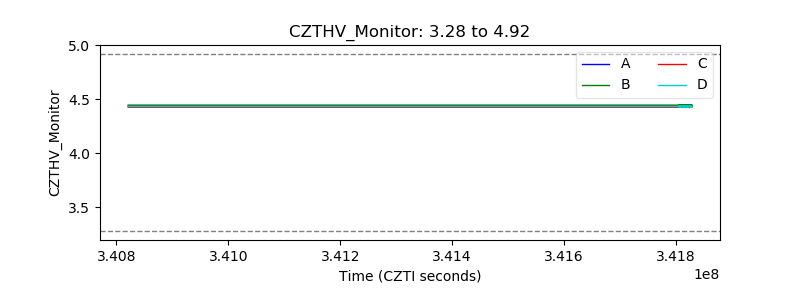 |
| D_VDD |  |
| Temperature 1 |  |
| Veto HV Monitor |  |
| Veto LLD |  |
| Alpha Counter |  |
| _CPM_Rate |  |
| CZT Counter | 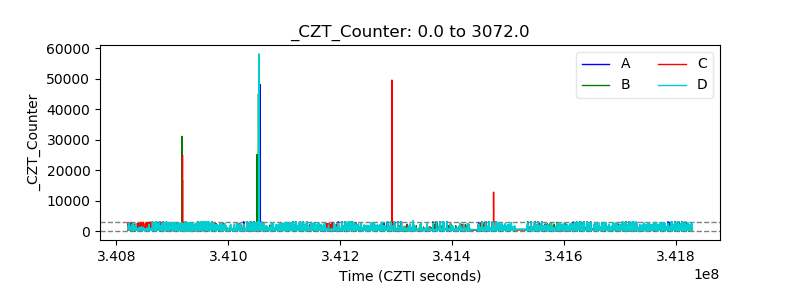 |
| +2.5 Volts monitor | 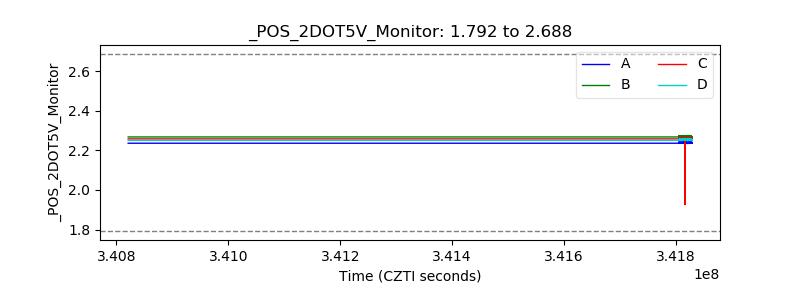 |
| +5 Volts monitor |  |
| _ROLL_ROT |  |
| _Roll_DEC |  |
| _Roll_RA |  |
| Veto Counter |  |