| Param | Original file | Final file |
|---|---|---|
| Filename | modeM0/AS1A09_038T15_9000003932cztM0_level2_bc.evt | modeM0/AS1A09_038T15_9000003932cztM0_level2_quad_clean.evt |
| Size (bytes) | 217,215,360 | 99,483,840 |
| Size | 207.2 MB | 94.9 MB |
| Events in quadrant A | 1,093,209 | 691,201 |
| Events in quadrant B | 1,203,384 | 699,772 |
| Events in quadrant C | 2,033,261 | 599,307 |
| Events in quadrant D | 1,882,565 | 654,290 |
| Mode M9 | |||
|---|---|---|---|
| Quadrant | BADHDUFLAG | Total packets | Discarded packets |
| A | 0 | 7 | 0 |
| B | 0 | 7 | 0 |
| C | 0 | 7 | 0 |
| D | 0 | 7 | 0 |
| Mode M0 | |||
|---|---|---|---|
| Quadrant | BADHDUFLAG | Total packets | Discarded packets |
| A | 0 | 10661 | 0 |
| B | 0 | 11016 | 0 |
| C | 0 | 16105 | 0 |
| D | 0 | 13151 | 0 |
| Mode SS | |||
|---|---|---|---|
| Quadrant | BADHDUFLAG | Total packets | Discarded packets |
| A | 0 | 104 | 0 |
| B | 0 | 104 | 0 |
| C | 0 | 104 | 0 |
| D | 0 | 104 | 0 |
| Quadrant | Total seconds | Saturated seconds | Saturation percentage |
|---|---|---|---|
| A | 5258 | 7 | 0.133130% |
| B | 5258 | 22 | 0.418410% |
| C | 5258 | 823 | 15.652339% |
| D | 5258 | 68 | 1.293267% |
Noise dominated data is calculated using 1-second bins in cleaned event files. If a bin has >2000 counts, and if more than 50% of those come from <1% of pixels, then it is considered to be noise-dominated and hence unusable.
| Quadrant | # 1 sec bins | Bins with >0 counts | Bins with >2000 counts | High rate bins dominated by noise | Noise dominated (total time) | Noise dominated (detector-on time) | Marked lightcurve |
|---|---|---|---|---|---|---|---|
| A | 5257 | 5257 | 0 | 0 | 0.00% | 0.00% | 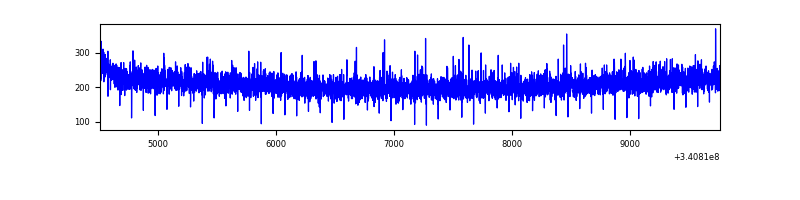 |
| B | 5257 | 5257 | 0 | 0 | 0.00% | 0.00% |  |
| C | 5257 | 5257 | 39 | 39 | 0.74% | 0.74% |  |
| D | 5257 | 5256 | 6 | 6 | 0.11% | 0.11% |  |
Top three noisy pixels from each quadrant. If the there are fewer than three noisy pixels in the level2.evt file, extra rows are filled as -1
| Pixel properties | Quadrant properties | ||||||
|---|---|---|---|---|---|---|---|
| Quadrant | DetID | PixID | Counts | Sigma | Mean | Median | Sigma |
| A | 13 | 254 | 8518 | 129.04 | 282 | 277 | 63.9 |
| A | 6 | 16 | 2187 | 29.91 | 282 | 277 | 63.9 |
| A | 0 | 226 | 1901 | 25.43 | 282 | 277 | 63.9 |
| B | 10 | 245 | 44993 | 790.75 | 284 | 278 | 56.5 |
| B | 15 | 32 | 44603 | 783.85 | 284 | 278 | 56.5 |
| B | 4 | 52 | 11843 | 204.52 | 284 | 278 | 56.5 |
| C | 2 | 16 | 1079782 | 18015.42 | 243 | 243 | 59.9 |
| C | 15 | 208 | 13340 | 218.56 | 243 | 243 | 59.9 |
| C | 0 | 207 | 3001 | 46.03 | 243 | 243 | 59.9 |
| D | 1 | 52 | 508774 | 7611.14 | 273 | 267 | 66.8 |
| D | 12 | 227 | 137934 | 2060.55 | 273 | 267 | 66.8 |
| D | 2 | 250 | 115564 | 1725.72 | 273 | 267 | 66.8 |
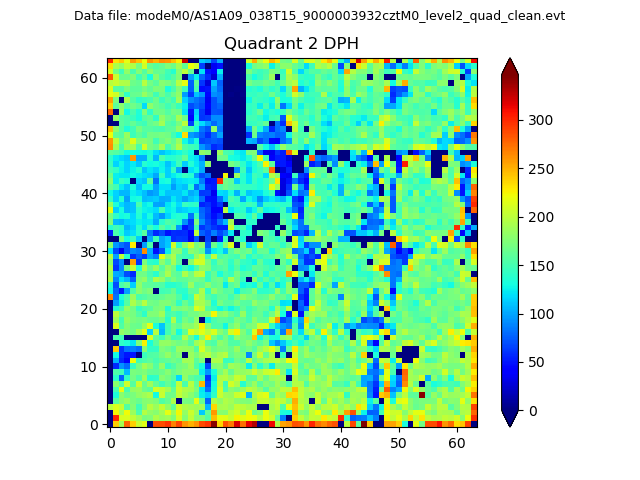
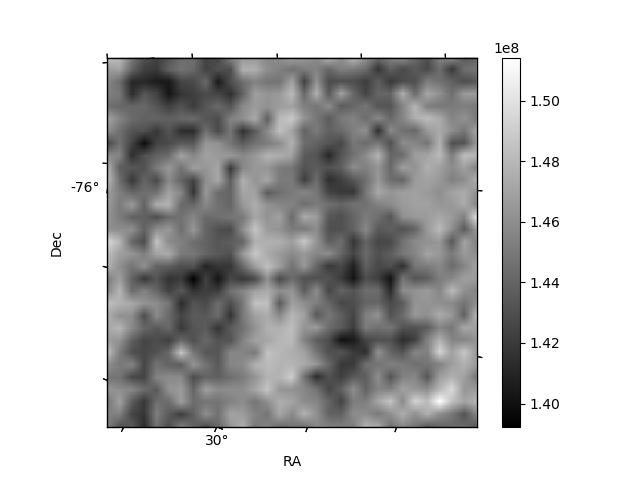
Histogram calculated using DETX and DETY for each event in the final _common_clean file
| Quadrant A |  |
 |
Quadrant B |
|---|---|---|---|
| Quadrant D |  |
 |
Quadrant C |
| Plot type | Count rate plots | Images |
|---|---|---|
| Comparison with Poisson distribution Blue bars denote a histogram of data divided into 1 sec bins. Red curve is a Poisson curve with rate = median count rate of data. |
 |
 |
| Quadrant-wise count rates Data is divided into 100 sec bins |
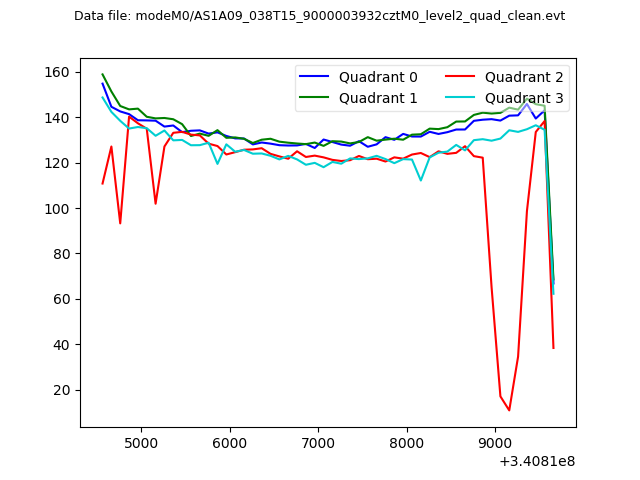 |
|
| Module-wise count rates for Quadrant A Data is divided into 100 sec bins |
 |
 |
| Module-wise count rates for Quadrant B Data is divided into 100 sec bins |
 |
 |
| Module-wise count rates for Quadrant C Data is divided into 100 sec bins |
 |
 |
| Module-wise count rates for Quadrant D Data is divided into 100 sec bins |
 |
 |
| Parameter | Plot |
|---|---|
| CZT HV Monitor |  |
| D_VDD |  |
| Temperature 1 |  |
| Veto HV Monitor |  |
| Veto LLD |  |
| Alpha Counter | 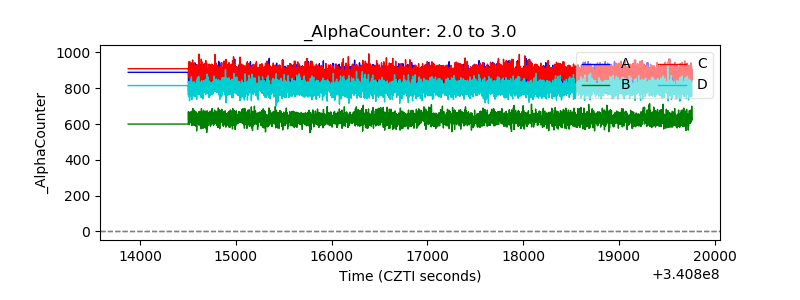 |
| _CPM_Rate |  |
| CZT Counter |  |
| +2.5 Volts monitor | 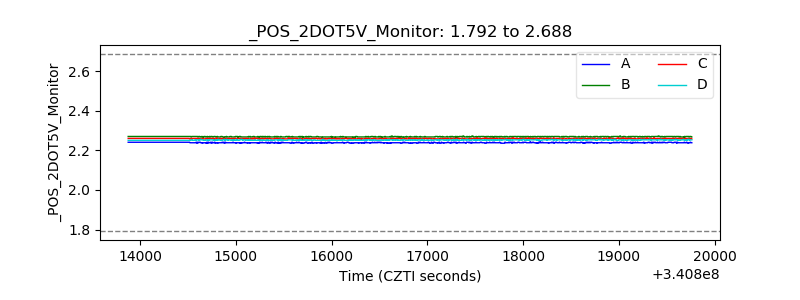 |
| +5 Volts monitor |  |
| _ROLL_ROT | 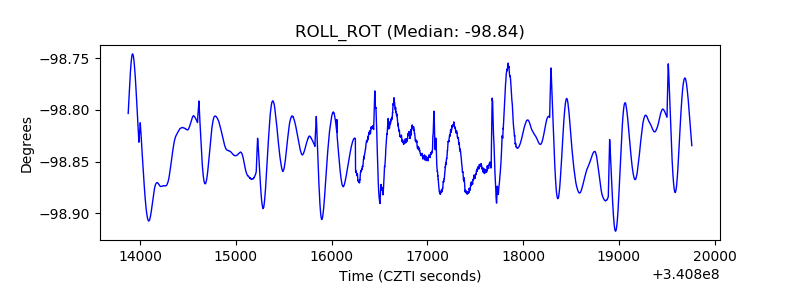 |
| _Roll_DEC |  |
| _Roll_RA |  |
| Veto Counter |  |