| Param | Original file | Final file |
|---|---|---|
| Filename | modeM0/AS1A09_038T14_9000003930cztM0_level2_bc.evt | modeM0/AS1A09_038T14_9000003930cztM0_level2_quad_clean.evt |
| Size (bytes) | 204,805,440 | 99,550,080 |
| Size | 195.3 MB | 94.9 MB |
| Events in quadrant A | 1,181,650 | 679,181 |
| Events in quadrant B | 1,218,136 | 686,414 |
| Events in quadrant C | 1,743,579 | 636,779 |
| Events in quadrant D | 1,697,705 | 648,707 |
| Mode M9 | |||
|---|---|---|---|
| Quadrant | BADHDUFLAG | Total packets | Discarded packets |
| A | 0 | 7 | 0 |
| B | 0 | 7 | 0 |
| C | 0 | 7 | 0 |
| D | 0 | 7 | 0 |
| Mode M0 | |||
|---|---|---|---|
| Quadrant | BADHDUFLAG | Total packets | Discarded packets |
| A | 0 | 10723 | 0 |
| B | 0 | 10875 | 0 |
| C | 0 | 13340 | 0 |
| D | 0 | 12181 | 0 |
| Mode SS | |||
|---|---|---|---|
| Quadrant | BADHDUFLAG | Total packets | Discarded packets |
| A | 0 | 104 | 0 |
| B | 0 | 104 | 0 |
| C | 0 | 104 | 0 |
| D | 0 | 104 | 0 |
| Quadrant | Total seconds | Saturated seconds | Saturation percentage |
|---|---|---|---|
| A | 5193 | 18 | 0.346620% |
| B | 5193 | 24 | 0.462161% |
| C | 5193 | 351 | 6.759099% |
| D | 5193 | 22 | 0.423647% |
Noise dominated data is calculated using 1-second bins in cleaned event files. If a bin has >2000 counts, and if more than 50% of those come from <1% of pixels, then it is considered to be noise-dominated and hence unusable.
| Quadrant | # 1 sec bins | Bins with >0 counts | Bins with >2000 counts | High rate bins dominated by noise | Noise dominated (total time) | Noise dominated (detector-on time) | Marked lightcurve |
|---|---|---|---|---|---|---|---|
| A | 5192 | 5192 | 1 | 1 | 0.02% | 0.02% |  |
| B | 5192 | 5192 | 1 | 1 | 0.02% | 0.02% |  |
| C | 5192 | 5192 | 25 | 25 | 0.48% | 0.48% |  |
| D | 5192 | 5192 | 2 | 2 | 0.04% | 0.04% |  |
Top three noisy pixels from each quadrant. If the there are fewer than three noisy pixels in the level2.evt file, extra rows are filled as -1
| Pixel properties | Quadrant properties | ||||||
|---|---|---|---|---|---|---|---|
| Quadrant | DetID | PixID | Counts | Sigma | Mean | Median | Sigma |
| A | 6 | 16 | 23867 | 360.32 | 299 | 295 | 65.4 |
| A | 13 | 254 | 8584 | 126.7 | 299 | 295 | 65.4 |
| A | 8 | 192 | 4564 | 65.26 | 299 | 295 | 65.4 |
| B | 0 | 190 | 21803 | 364.81 | 299 | 294 | 59.0 |
| B | 10 | 245 | 16478 | 274.5 | 299 | 294 | 59.0 |
| B | 15 | 32 | 11041 | 182.28 | 299 | 294 | 59.0 |
| C | 2 | 16 | 671650 | 10132.72 | 274 | 274 | 66.3 |
| C | 15 | 208 | 12996 | 192.01 | 274 | 274 | 66.3 |
| C | 7 | 247 | 4008 | 56.36 | 274 | 274 | 66.3 |
| D | 10 | 0 | 328562 | 4730.29 | 289 | 282 | 69.4 |
| D | 1 | 52 | 163413 | 2350.61 | 289 | 282 | 69.4 |
| D | 2 | 250 | 51240 | 734.27 | 289 | 282 | 69.4 |
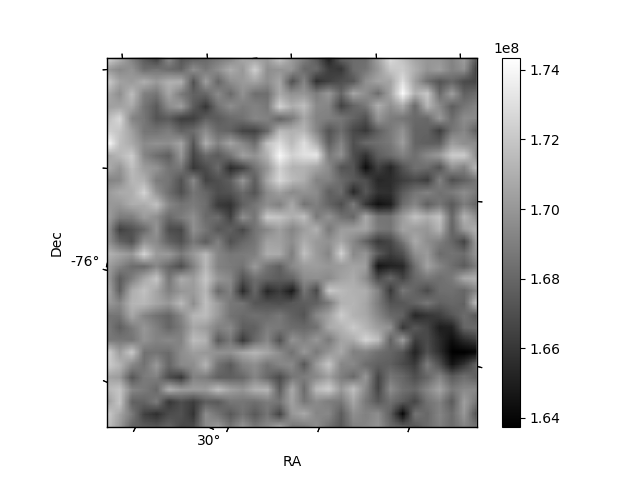
Histogram calculated using DETX and DETY for each event in the final _common_clean file
| Quadrant A |  |
 |
Quadrant B |
|---|---|---|---|
| Quadrant D |  |
 |
Quadrant C |
| Plot type | Count rate plots | Images |
|---|---|---|
| Comparison with Poisson distribution Blue bars denote a histogram of data divided into 1 sec bins. Red curve is a Poisson curve with rate = median count rate of data. |
 |
 |
| Quadrant-wise count rates Data is divided into 100 sec bins |
 |
|
| Module-wise count rates for Quadrant A Data is divided into 100 sec bins |
 |
 |
| Module-wise count rates for Quadrant B Data is divided into 100 sec bins |
 |
 |
| Module-wise count rates for Quadrant C Data is divided into 100 sec bins |
 |
 |
| Module-wise count rates for Quadrant D Data is divided into 100 sec bins |
 |
 |
| Parameter | Plot |
|---|---|
| CZT HV Monitor |  |
| D_VDD |  |
| Temperature 1 |  |
| Veto HV Monitor | 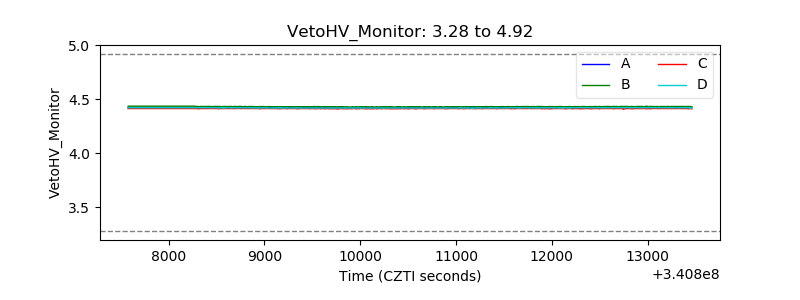 |
| Veto LLD |  |
| Alpha Counter |  |
| _CPM_Rate |  |
| CZT Counter |  |
| +2.5 Volts monitor |  |
| +5 Volts monitor |  |
| _ROLL_ROT |  |
| _Roll_DEC |  |
| _Roll_RA |  |
| Veto Counter |  |